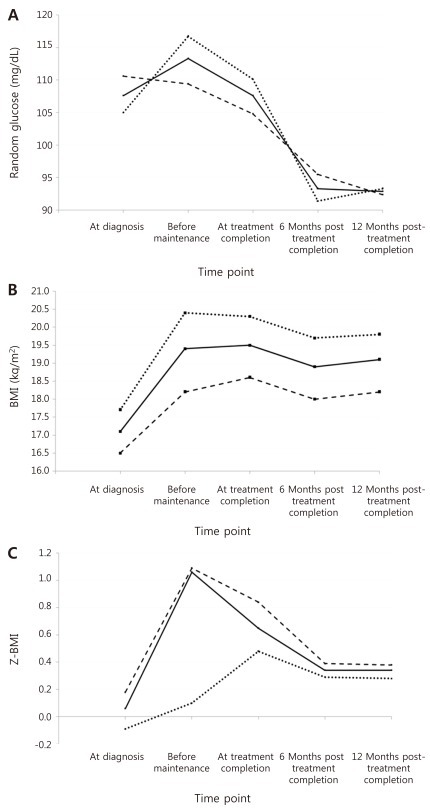
Fig. 2.
Mean values for random glucose (A), body mass index (BMI) (B), Z score for BMI (Z-BMI) (C) at all 5 time points for the full cohort of 88 patients up to 12 months after the completion of treatment (bold line), as well as for subcohorts of low-standard risk patients (dashed line) and high-very high risk patients (dotted line).

