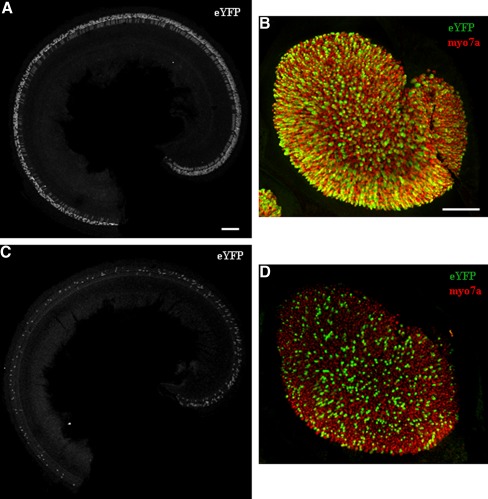
FIG. 3.
Comparison of the transgenic lines, Atoh1-CreERTM and Atoh1-CreERT2. Representative confocal projection images of the apical turn of the cochlea (A) and utricle (B) from Atoh1-CreERTM;ROSA26eYFP mice, induced with tamoxifen at P0 and P1. Representative confocal projection images of the apical turn of the cochlea (C) and utricle (D) from Atoh1-CreERT2;ROSA26eYFP mice, induced with tamoxifen at P0 and P1. In A and C, eYFP is in white. In B and D, eYFP is in green and the HC marker, myosin VIIa (myo7a), is in red. Scale bars, 100 μm.

