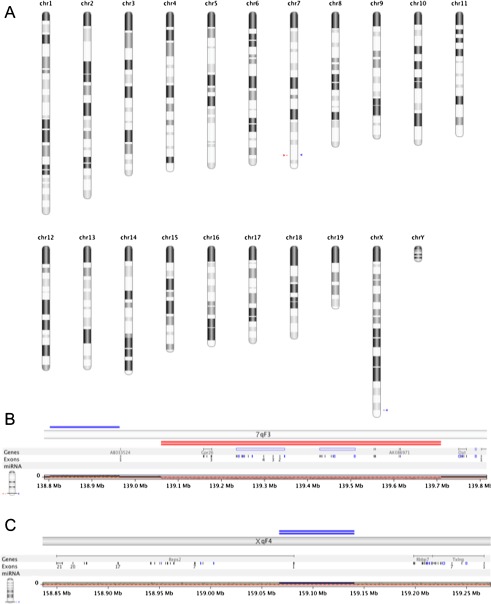
FIG. 6.
Comparative genomic analysis (aCGH) of hb/hb and +/+ genomes. A All chromosome view of significant genomic variations in the hb/hb genome showing loss (red arrowhead) and gain (blue arrowhead) in chromosome 7 and a gain (blue arrowhead) on the X chromosome. B View of chromosome 7qF3 region showing copy number variations. Single blue line depicts gain (ch7/qF3 138,802,774–138,964,543) and double red lines depict homozygous loss of genomic region encompassing chr7qF2: 139,060,510–139,709,028. C View of chromosome XqF4 showing a gain of chX/qF4 159,067,363–159,140,649.

