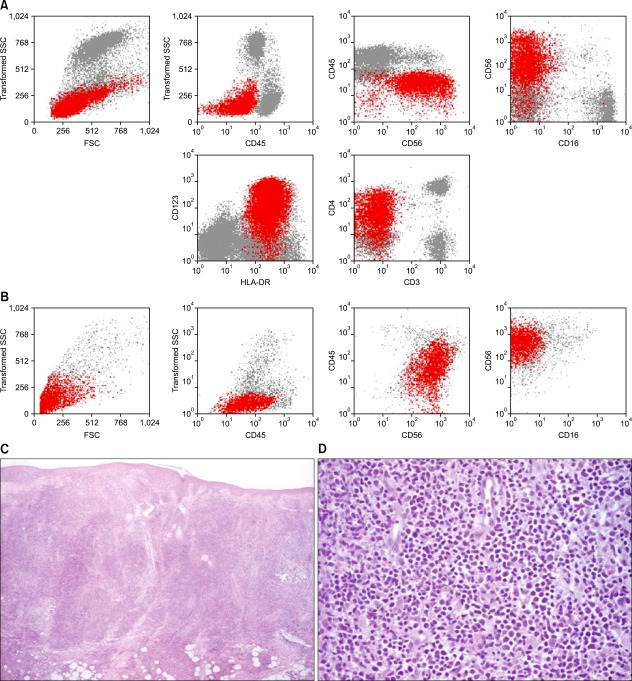
Fig. 2.
(A, B) Flow cytometry dot plots of peripheral blood (A) and skin (B) cells showing blastic plasmacytoid dendritic cells (blastic plasmacytoid dendritic cell neoplasm, red dots), respectively, expressing CD45 (dim), CD4 (dim), CD56, CD123, and HLA-DR. (C, D) Histopathological examination of a cutaneous lesion. (C) Diffuse infiltrate occupying the entire dermis and infiltrating the subcutaneous tissue (hematoxylin and eosin stain [H&E]; original magnification, ×4). (D) Higher amplification of the large blastic cells with large irregular nuclei (H&E; original magnification, ×40). SSC: side scatter; FSC: forward scatter.

