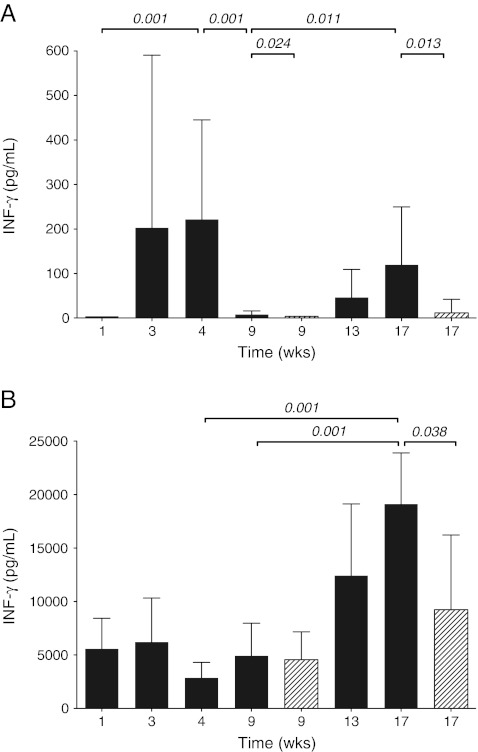
Fig. 2.
IFN-γ production in blood from mice (n = 7) during the course of untreated TB infection and TB-infected mice receiving therapy. Blood samples were processed in IGRA. Mice without therapy (dark gray bars) and mice receiving therapy (diagonally striped bars). a IGRA results (Mtb-specific-antigens responses minus the negative controls). b Positive controls. Data shown are mean IFN-γ concentrations of measurements in duplicate. The whiskers represent the standard deviation (SD). Statistical significance if present (p-value ≤0.05) is indicated

