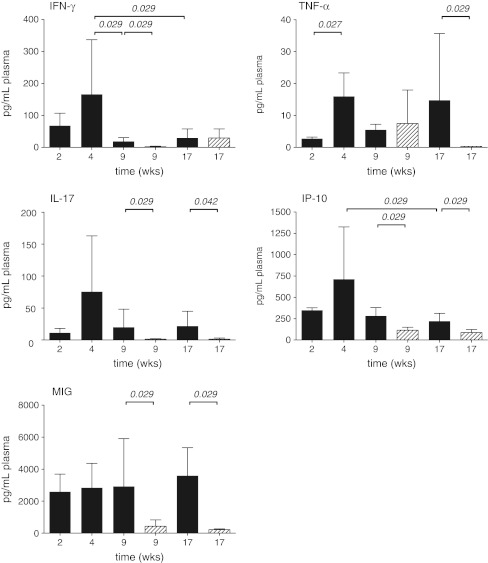
Fig. 3.
Concentrations of cytokines or chemokines in plasma from mice (n = 4) during the course of untreated TB infection and TB-infected mice receiving therapy: mice without therapy (dark gray bars) and mice receiving therapy (diagonally striped bars). Data shown are mean concentrations of cytokines or chemokines of measurements in duplicate. The whiskers represent the standard deviation (SD). Statistically significance if present (p-value ≤0.05) is indicated

