
Fig. 2.
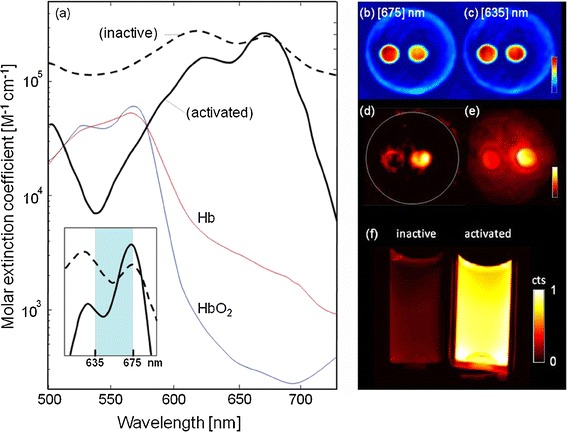
a Measured spectral extinction characteristics of inactive (dotted line) versus activated (solid gray line) MMPSense™ 680 probe. Spectra of oxy- and deoxyhemoglobin are also shown for reference. Inset: zoom-in from the wavelength range that was used for MSOT imaging. b Optoacoustic image of phantom with MMPSense™ insertions at 635 nm excitation. Circular insertion containing activated probe is on the right while the inactive insertion is on the left. c Corresponding optoacoustic image at 675 nm excitation. d Multispectrally resolved (MSOT) image resolving the distribution of activated probe inside the phantom. e Planar (top view) fluorescence image of the phantom performed after MSOT imaging sessions, confirming fluorescence from the activated probe. f Planar fluorescence image comparing inactive (left) and active MMPSense™.