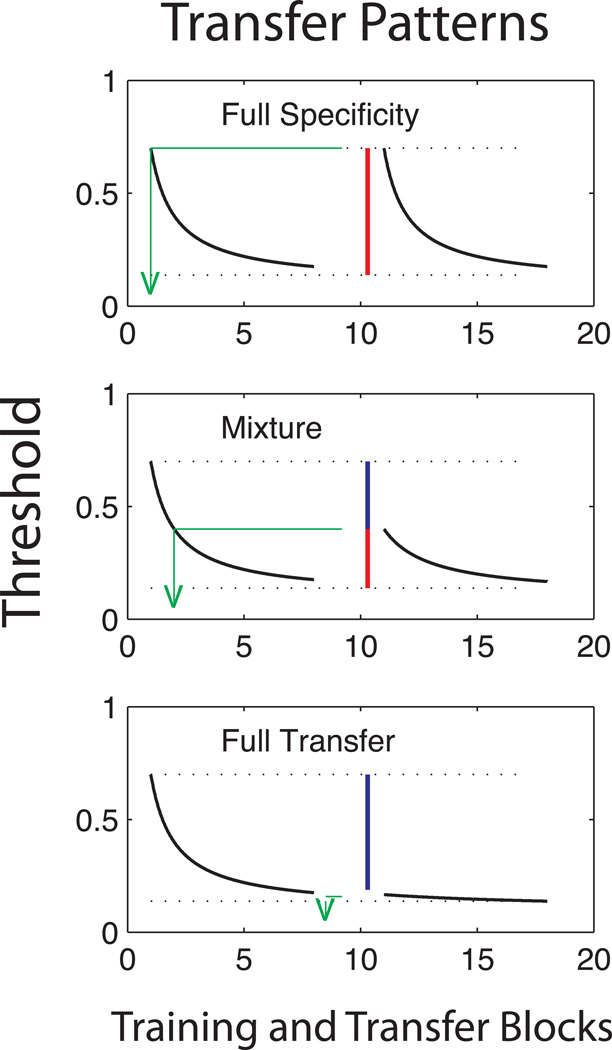
Figure 1.
A schematic illustration shows full specificity (top), partial transfer/partial specificity (middle) or full transfer (bottom). Black lines show hypothetical improvements in a threshold performance measure with perceptual learning, with the learning curves on the left for initial training, and the learning curves on the right for transfer phase training. Blue vertical lines mark the improvements in performance due to transfer, while red vertical lines mark the converse failure to transfer, or specificity. The transfer can also be characterized in terms of the equivalent amount of practice required to yield the performance level at the point of task switch, shown by the green lines dropped to the practice axis at the equivalent blocks of learning at the point of transfer.

