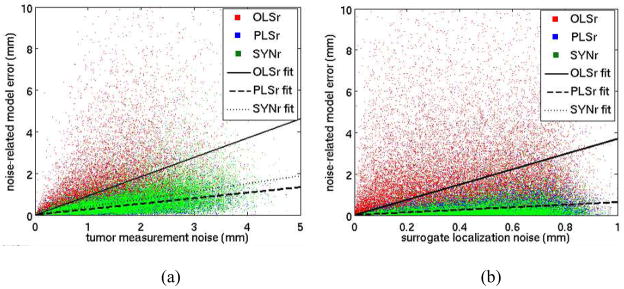
Figure 8.
(a) Tumor and (b) external marker localization noise (in the training data used to build the model that predict tumor position) versus tumor position prediction error. Best fit lines represent least-squared-error linear regression fits with an assumption of zero error for zero noise. OLSr regression lines have slopes of (a) 1.1 and (b) 3.7. The PLSr line overlies the SYNr line in (b).

