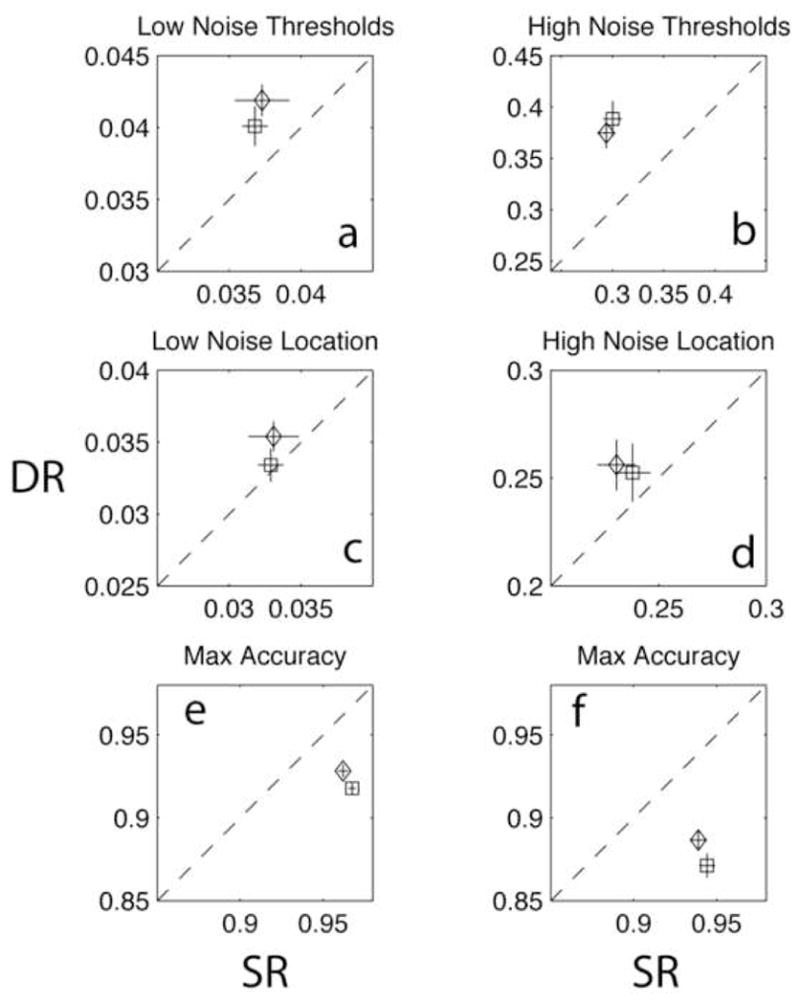
Figure 9.

Contrast thresholds at 79% correct (panels a–b) and Weibull location (αi) (c–d) and maximum accuracy (e–f) parameter estimates for the average psychometric functions, Experiment 3 (Figure 7), for low (left) and high (right) noise. Dual-object (DR) performance is plotted against single object (SR) performance, with triangles for congruent frames (/ / or \ \) and squares for incongruent frames (/ \ or \ /) data. Error bars show ±1σ estimated from Monte Carlo methods (see text).
