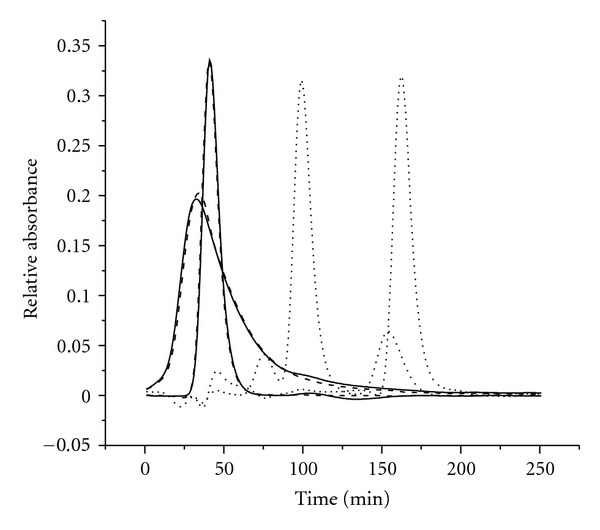
Figure 3.

Normalized chromatographic profiles were resolved by the SWATLD in human plasma. Solid and dotted lines represent the chromatographic profiles of vancomycin, cephalexin, and interference. The medium dash denotes the actual vancomycin and cephalexin.
