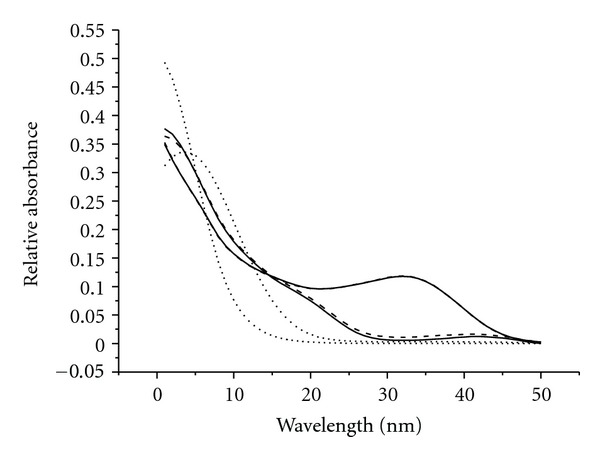
Figure 4.

Normalized UV-Vis spectral profiles were resolved by the SWATLD in human plasma. Solid and dotted lines represent the UV-vis spectral profiles of vancomycin, cephalexin, and interference. The medium dash denotes the actual vancomycin and cephalexin.
