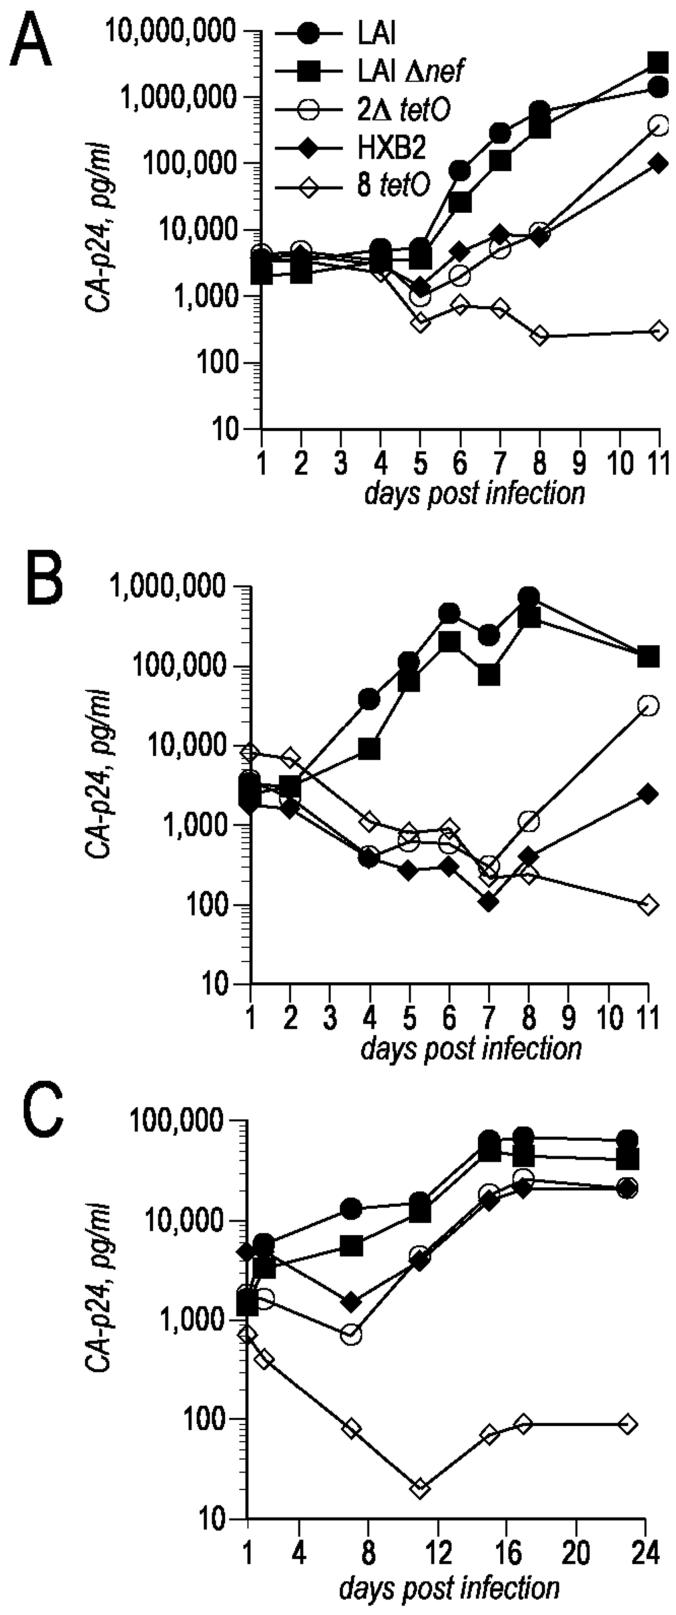
Figure 5.
Replication kinetics in primary cells. Equivalent amounts (25 ng of CA-p24) of the indicated viruses were used to infect the SupT1 T cell line (A), PBMCs after phytohemagglutinin activation (B), and unstimulated PBMCs (C). Virus replication was monitored by measuring CA-p24 production in the supernatant.

