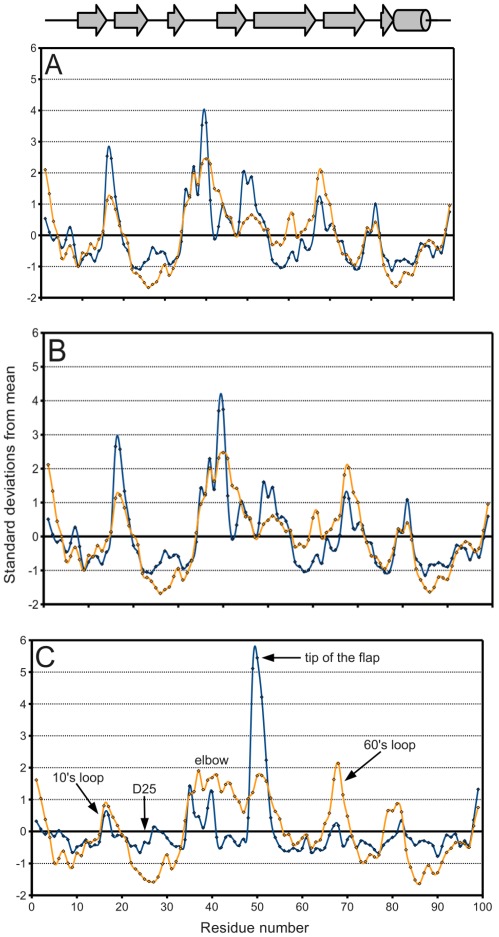
Figure 5.
PR B-factor (orange) and spatial displacement (blue) variation with residue number. (A) Final data set, (B) bound monomers, (C) ligand-free monomers. Values were normalized for comparison purposes. Mean and standard deviation values are given in Table 2. Secondary structure elements are identified.

