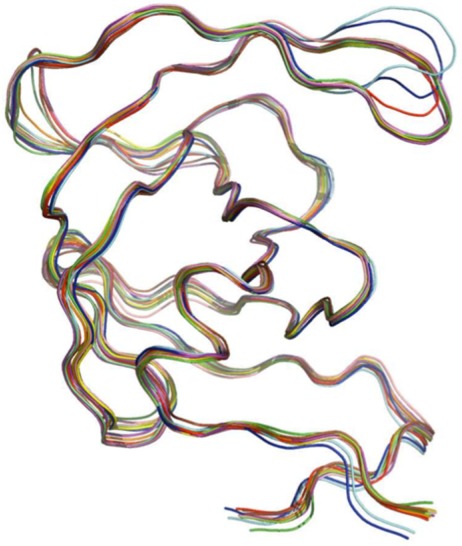
Figure 7.
Superposition of mean PR monomer structures for the space groups: P21 (orange), C2 (red), P21212 (chartreuse), P212121 (yellow), I222 (purple), P41 (cyan), P43 (lime green), P41212 (blue), P43212 (magenta), I4122 (salmon), P61 (olive), P65 (brown), P6122 (pink) and I213 (green). Ribbon diagram rendered using PyMOL. Table 3 describes the distribution of space groups in the final data set.

