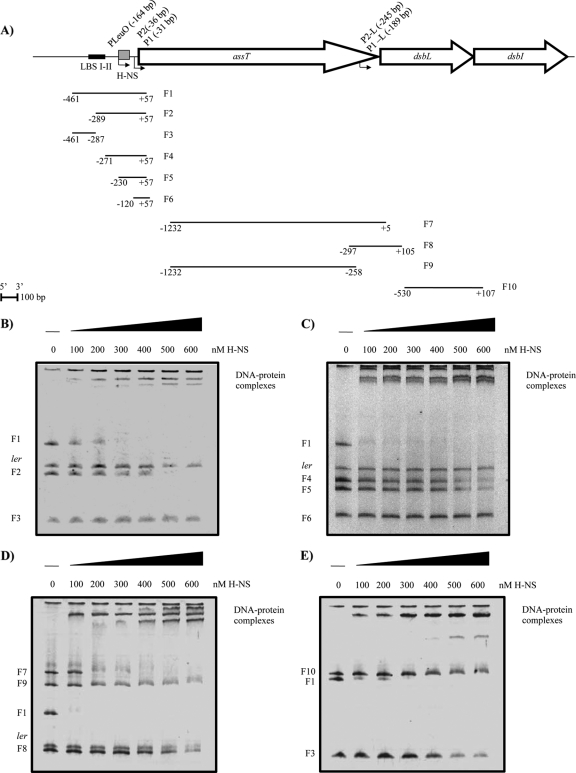
Fig 8.
EMSAs of H-NS with various DNA fragments from the assT-dsbL-dsbI cluster. (A) DNA fragments utilized. The coordinates of the fragments according to the ATG of each gene are shown. EMSAs were performed with increasing amounts of H-NS (0 to 600 nM) for assT (B and C), dsbL (D), and dsbI (E). The structural ler gene from EPEC was used as a negative control for some experiments.

