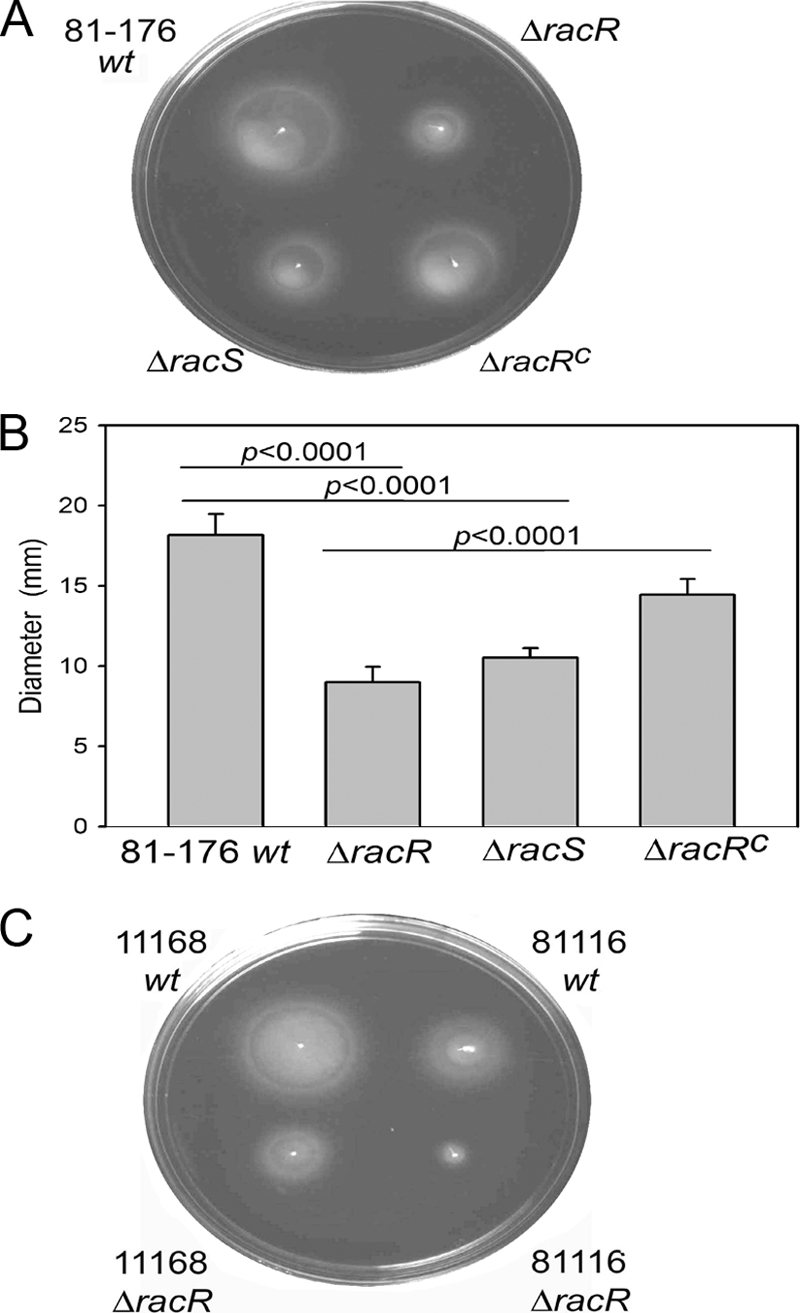
Fig 7.

Motility analysis of wt C. jejuni and the ΔracR and ΔracS mutants. (A and B) Representative images of semisolid motility plates incubated for 28 h at 38°C with the 81-176 wt, ΔracR, ΔracS, and ΔracRC strains (A) and quantification of halo diameters (B). Values are averages of data from at least six independent experiments, and the standard deviations are represented by error bars. (C) Representative images of motility plates of wt and ΔracR mutant strains of C. jejuni 11168 and 81116.
