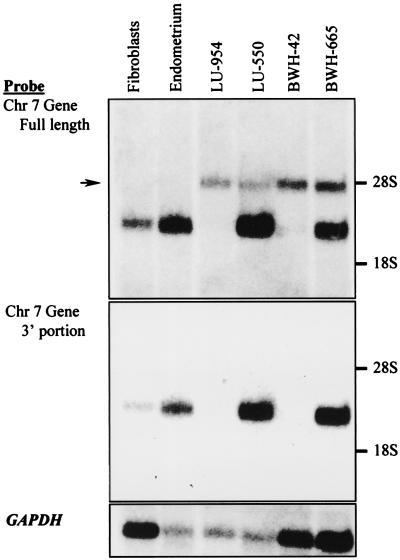
Figure 3.
Northern blot analyses of poly(A)+ RNA from ESSs and normal control tissues. The source of normal fibroblasts was the same as that in Fig. 2, whereas normal endometrium was obtained from an unrelated patient. (a) Analysis performed with a probe for the 5′ end of EST AA431106 (nucleotides 74 to 1561 of JAZF1 in Fig. 5a). The arrow indicates the position of a band corresponding to a ≈4.5-kb transcript seen only in tumor samples. (b) Analysis performed with a probe for the 3′ end of EST AA431106 (nucleotides 1120 to 2883 of JAZF1 in Fig. 5a). (c) Analysis with a probe for the GAPDH gene used as a control for the quality and amount of RNA on the blot.

