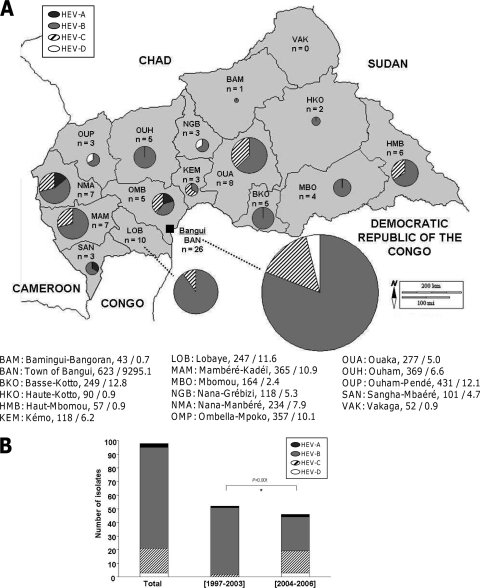
Fig 1.
Distribution of the 98 HEV VP1 sequences. (A) Geographic distribution of the sequences in the 16 prefectures of the CAR and in the town of Bangui. Below the map, the number of inhabitants (in thousands) and the population density (in inhabitants per square kilometer) are indicated for each prefecture and for Bangui (data are from the 2003 census). (B) Distribution of the VP1 sequences within the 4 HEV species according to the period of isolation. *, chi-square analysis. The figure was drawn with an outline map provided by d-maps.com (http://d-maps.com/index.php?lang=fr).

