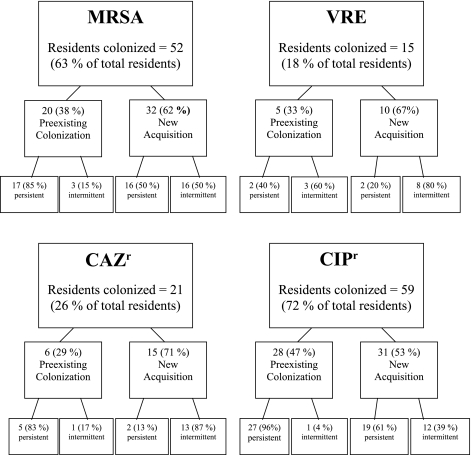
Fig 1.
Flow chart displaying the total number of residents colonized and the percentage of colonization for each organism. Unless otherwise stated, the percentages in parentheses represent the percentage of residents colonized out of the number of residents colonized in that group with that organism (e.g., 17 [85%] of 20 preexisting colonizations were intermittent). MRSA, methicillin-resistant Staphylococcus aureus; VRE, vancomycin-resistant enterococci; CAZr, ceftazidime-resistant Gram-negative bacillus; CIPr, ciprofloxacin-resistant Gram-negative bacillus.

