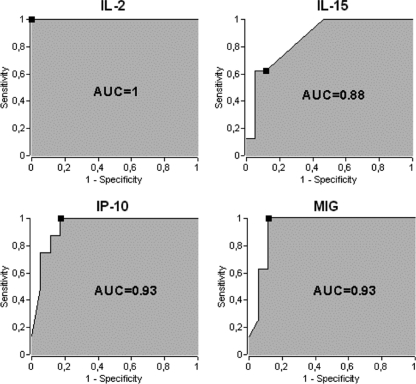
Fig 2.
Determination of additional biomarkers for the diagnosis of HCW with LTBI. IL-2, IL-15, IP-10, and MIG secretion levels were quantified in QFT supernatants, and ROC curves display sensitivity versus specificity for each biomarker in differentiating the LTBI-positive group from the LTBI-negative group. The black squares correspond to the maximum YI. The AUC is indicated in each graph.

