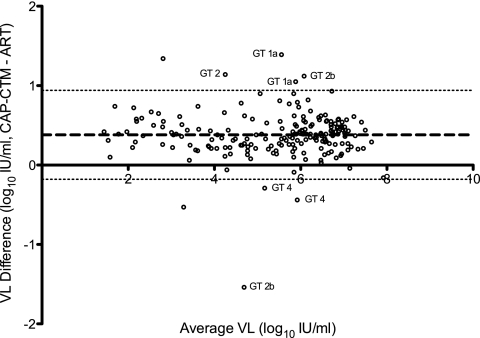
Fig 2.
Bland-Altman plot of differences in viral loads between CAP-CTM and ART assays versus the means of the 2 results. Genotypes of outliers are indicated except for those with indeterminate genotypes. The bold dotted line indicates the mean VL difference, and the lighter dotted lines indicate the 95% confidence limits.

