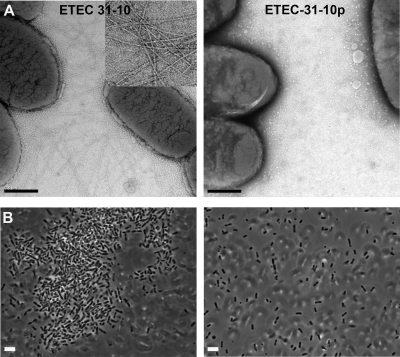
Fig 1.
ETEC pilus expression correlates with bacterial aggregation. (A) TEM images of ETEC strains 31-10 and 31-10p after overnight growth on CFA agar plates. Inset: close-up of pili on 31-10 cells. Scale bar, 0.5 μm. (B) Phase-contrast images of ETEC 31-10 and 31-10p grown on CFA agar, suspended in PBS (pH 7.0, 100 mM NaCl), and allowed to settle for 60 min.

