Fig 5.
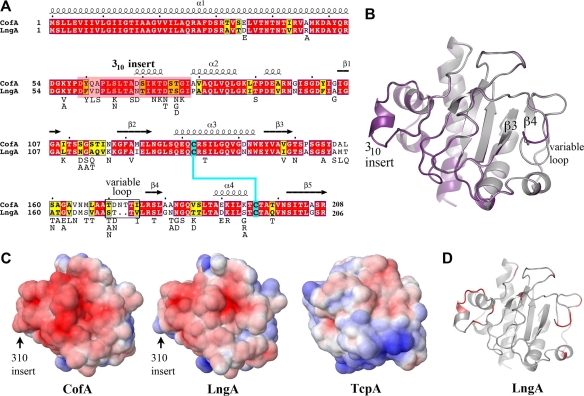
Comparison of the CofA and LngA amino acid sequences and structures. (A) Amino acid sequence alignment of CofA and LngA (ETEC strain E9034A; GenBank accession number AAC33154). CofA and LngA share 76% amino acid sequence identity and 87% similarity. Sequences were aligned manually based on superposition of the LngA homology model with CofA. The color scheme is as described for Fig. 1A. The secondary structure of CofA is indicated above the sequence. LngA sequences were compared further, and variant residues are listed below the LngA sequence. (B) Superposition of the ΔN-LngA homology model (purple) on the ΔN-CofA crystal structure (gray), showing the divergent “variable loop” that precedes strand β4. (C) Electrostatic surfaces of CofA, LngA, and TcpA globular domains, showing the pilin face predicted to be exposed on the pilus filament. The orientation of each structure is similar to that shown in panel B. Proteins are colored according to electrostatic potential, calculated using DELPHI (39), with red representing negative charge, blue is positive, and white is uncharged (scale, −7 kT to +7 kT). (D) LngA homology model, showing that variable residues (red) are localized to the exposed LngA face.

