Abstract
Brian Computer Interface (BCI) is a direct communication pathway between the brain and an external device. BCIs are often aimed at assisting, augmenting or repairing human cognitive or sensory-motor functions. EEG separation into target and non-target ones based on presence of P300 signal is of difficult task mainly due to their natural low signal to noise ratio. In this paper a new algorithm is introduced to enhance EEG signals and improve their SNR. Our denoising method is based on multi-resolution analysis via Independent Component Analysis (ICA) Fundamentals. We have suggested combination of negentropy as a feature of signal and subband information from wavelet transform. The proposed method is finally tested with dataset from BCI Competition 2003 and gives results that compare favorably.
Keywords: Brian Computer Interface, Denoising, Independent Component Analysis, P300 Speller, Negentropy, Wavelet Transform
Introduction
The Brian Computer interface (BCI) system is set of signal processing components and sensors that allows acquiring and analyzing brain activities with the goal of establishing a communication channel directly between the brain and an external device such as a computer, neuroprosthesis, and etc , by analyzing electroencephalographic activities that reflect the functions of the brain[16,19].
There are many BCI systems based on EEG rhythms, as Alpha, Beta, Mu, Slow Cortical Potentials (SCPs), Event Related Synchronization/ Desynchronization (ERS/ERD) phenomena, Steady-State Visual Evoked Potential (SSVEPs), P300 component of the Evoked-Related potentials (ERP's) and so on[22].
P300 Based BCI was first introduced by Farwell and Donchin in 1988 for controlling an external device[5,8,11,12].
The P300 (P3) wave is an event related potential elicited by task-relevant, infrequent stimuli. This wave is considered to be an endogenous potential as its occurrence links to a person's reaction to the stimulus, not to the physical attributes of a stimulus. This is a positive ERP, which its occurrence is over the parietal cortex with a latency of about 300 ms after rare or task relevant stimuli. Mainly, the P300 is thought to reflect tasks involved in stimulus evaluation or categorization[6].
Within BCI, P300 potentials can provide a means of detecting a person's intention concerning on the choice of object.
Detecting the p300 peaks in the EEG accurately and accurately, is the main goal In a P300 speller, therefore variety of feature extraction and classification procedures have been implemented, improving the performance. a good preprocessing step could enhance the SNR and help to have simple, more accurate algorithm for feature extraction and classification. More reliable and ever fast signal processing methods for preprocessing the recorded data are crucial in the improvement of practical BCI systems.
Single-trial ERP detection is understood to be challenging, as P300 waves and other task related signal components have a large amount of noise (artifacts-ongoing task and unrelated neural activities)[6,24]. A preprocessing step for P300 detection is applied to enhance the Signal to Noise Ratio (SNR) and to remove both interfering physiological signals as those related to ocular, muscular and cardiac activities , and non-physiological artifacts, such as electrode movements, broken wire contacts and power line noise. To detect the specific patterns the feature extraction step is conducted in brain activity that encode the patient's motor intentions or reflect the user commands. Translating feature into control signals is aimed at last step to sent to an external device[10,16].
Several methods, based on Independent Component Analysis (ICA), Fourier Transform and Wavelet Transform (WT) were thus proposed to enhance the SNR and to remove the artifacts from EEG signals[13,24].
The major drawback of ICA-based method is that they are supervised and they are not specifically designed to separate brain waves. For instance ICA is a popular method to EEG denoising but after the decomposition in independent components (IC) it is necessary to select (by spatio-temporal prior or manually) the ICs which contained the evoked potentials.
Wavelet denoising techniques have been adopted for signal enhancement applications. EEG signal is first mapped to discrete wavelet domain by means of multiresolution analysis. Details coefficients related to additive noise could be eliminated using a contrast or adaptive threshold level. Finally signal is reconstructed back to time domain using remaining wavelet coefficients.
Donoho[7] suggested a denoising technique in the wavelet domain in order to enhance the domain. It is by thresholding the wavelet coefficients in the orthogonal wavelet domain. Two thresholding algorithms were proposed, namely the soft thresholding and hard thresholding.
So to denoising the signal, choosing a good threshold and algorithm would help having more clear signals.
In this paper, we propose a new unsupervised algorithm to automatically estimate noise subspace from raw EEG signal. The aim is to provide a new method to increasing the spelling debit.
In particular our algorithms is a adaptive wavelet denoising which is one of the best method for signal denoising. The threshold on each WT levels are different and dependence of negentropy. Negentropy is the mainly parameter that ICA work based on. Negentropy of each level in WT is calculated and the lowest level negentropy introduced for certifiable parameter. Other levels negentropy compare with this one and independency of such levels and the main (the lowest level) acquired. This independency, determine the threshold. More independency describe more different signals that noise (of any source except) have been added to it. So the threshold must be increased to eliminate the noise.
This paper organized as follows: Section 2 describe the P300 subspace and the BCI Enhancement. Section 3 describe Independent Component Analysis and Wavelet Transform whereas Section 4 present our proposed algorithm. In the last parts, Section 5 and 6 have simulated result and conclusion.
Methodology
On the P300 based BCI, the user was presented with a screen that is a 6*6 character matrix with 36 symbols. The user then, one by one, focuses a on letters of an expected word. The columns and rows of the matrix are randomly flashed. For concerning the letter of the word there are 12 illuminations (6 columns and 6 rows) which provide the visual stimulus. Two flashes (one column and one row) out of the twelve intensifications decide a character which the user wants to say. It is expected that the evoked waveforms are different from others[10,16]. Each row and column in the matrix was randomly illuminated for 100ms. After illumination of a row/column, for 75ms the matrix was blank. For each character sets of 12 illuminations were repeated 15 times. So there were 180 illuminations for each character. After all illuminations the matrix is blank for 2.5s[10].
To improve and validate signal processing and classification methods for BCIs, some BCI groups organized an online BCI data bank, known as the BCI competition datasets. These datasets consist of continuous single-trials of EEG activity, one part is training data and another part is test data which is unlabeled. Initially the labels for test data were not available for the purpose of the competition. The labels for testing sets are released and the data sets became available for developing new methods towards improving BCI studies. This paper uses EEG signals of the BCI competitions 2003 dataset-IIb which are recorded from a P300/ERP based BCI word speller[16].
Reducing noise of signals will help P300 detection. We proposed method to enhance EEG with adaptive WT via ICA concepts. It is demonstrated that channel Cz has mainly data and more accurate to detect P300, so most of the studies rely on this record[6].
Independent Component Analysis
To alleviate the influence of noise, in this research, an independent component analysis ICA-based denoising scheme is proposed and integrated with adaptive wavelet denoising .
The methodology of Independent Component Analysis (ICA) was first introduced in the context of neural networks[3]. Delorme et al[1] utilized ICA as an important algorithm for EEG analysis. The goal of ICA is to separate instantaneously mixed signals into their independent sources without knowledge of mixing process. One practical application of ICA decomposition is the Evoked Related Potential and electroencephalogram analysis. The recorded signal can be considered as different sources in the brain and various artifacts that generate electrical signals. ICA is presented of interesting sources[25] or automated classification of epileptiform activity[20] and artifact removal[21].
Hidden information is called the independent components (ICs) of the data. The noise information usually cannot be directly obtained from the observed data. Thus, ICA can be used to detect and remove the noise via the identification of the ICs of the time series data, and improve the performance of the specific patterns in brain activity.
Let X = [x1,x2,x3,...,xm]T be a multivariate data matrix of size m*n, m≤n consisting of observed mixture signals xi (size 1*n , i=1,2,.., n).
In the ICA model, the matrix X can be introduced as[20,21]:

Where si is the i-th row of the m*n source matrix S and ai is the i-th column of the m*m unknown mixing matrix. Vectors si are the latent source signals that cannot be observed from the mixture signals xi. The ICA algorithm aims at finding an m*m de-mixing matrix W such as:
Y = [yi] = wx (2)
Where yi is the i-th row of the matrix Y (i=1,2, … m) . The vectors yi must be as statistically independent as possible, and are called as independent components. When de-mixing matrix W completely is the inverse of mixing matrix A, ICs (yi) can be used to estimate the latent source signal si.
The ICA algorithm is formulated as an optimization problem by setting up the measure statistical independence of ICs as an objective function. To do this, using some optimization techniques for solving the de-mixing matrix W is suggested. In general, the ICs are obtained by using the de-mixing matrix W to multiply the original matrix. This matrix can be determined by using an algorithm which maximized the statistical independence of ICs. The statistical independence obtained by ICs with non-gaussian distribution[20]. The negentropy can measure the non-Gaussianity of the ICs such as :
J(y) = H(ygauss) – H(y) (3)
Where ygauss is a Gaussian random vector having the same covariance matrix like y. H is the entropy of random vector y defined by H with density p(y):
H(y) = –∫ p(y) log p(y)dy (4)
The negentropy is zero if and only if the vector has a Gaussian distribution and it is always non-negative parameter.Since the problem in using negentropy is computationally very difficult, an approximation of this parameter is proposed as follows[16,24]:
J(y) ≈ [E{G(y)} – E{G(v)}]2 (5)
Where E stand for entropy, v is a Gaussian variable of zero mean and unit variance, and y is a random variable with same mean and variance. G is a nonquadratic function, and is given by G(y)=exp(–y2/2) in this study[22].
We can find the de-mixing matrix with optimization. This maximization in described method, FASTICA, is achieved using an approximate Newton iteration. After every iteration, to prevent all vectors from converging to the same maximum, (that would yield several times the same source), the p-th output has to be decorrelated from the previously estimated sources. A deflation scheme based on a Gram-Schmidt orthogonalization is a simple way to do this[6,9,24].
Wavelet Transform
It has been shown that EEG is a classical non stationary signal. Short time fourier transform (STFT), which was a time-frequency analysis method, was applied to analyze brain signals but it has been noted that the transform depends critically on the window. Wavelet Transform (WT), that is a multi-resolution analysis method , brings solution to this task and give a more accurate temporal localization[14]. In the research of brain signal enhancement, a more accurate local band denoising required Wavelet Transform could help to eliminate noise, which we interested in, That can generate spectral resolution[14,15].
In particular the Wavelet Transform forms a signal representation which is local in time and frequency domains. The WT relies on smoothing the time domain signal at various scales thus if ψs(x) represents as wavelet at scale s, the WT of such a function like f(x)∈L2(R) is defined as a convolution[17]:
Wf(s,x) = f*ψs(x) (6)
The scaled wavelet are constructed from a ‘Mother’ wavelet, ψ(x):
ψs(x)= (1/s)ψ(x/s) (7)
With a Gaussian function, G(x), the ‘Mother’ wavelet will be defined as[11]:

From knowledge of the modulus maxima of WT, the signal f(x) may be reconstructed to a good approximation. These maxima propose a compact representation idea for noise removal.
The existing research uses a lipschits exponent method based on least square. Lipschitz exponent-α (L.E.α) is a criteria to quantize locally regulation of function in mathematics[7,26]. L.E. αat one point can reflect the signal singularity in that area of function. This means that its smoothness increases and signal singularity diminish with α.
Order 0 ≤α < 1, and assuming that a constant (C) exists that makes:

The lipschitz exponent at x0 point is called α. If the function is nth differentiable, but nth derivative of f(x) is uncontinuously, the lipschitz exponent of ∫ f (x) dx is up to α+1 when n ≤ α < n+1 (n being the nearest integer to α)[15,16].
So it is possible to characterize isolated singularities when they occur in a smooth signal. Furthermore for such point like x in the neighbor of x0, where f(x) is α-Lipschitz at x0, the modulus maxima of the WT evolve with scale s, according to:
|Wf(s,x)|≤ Asα (10)
Where A is a constant[16].
To determine α, WT of one typical EEG segment calculated and by formula (10) it's Lipschitz have to be zero (figures 1–3).
Fig 1.
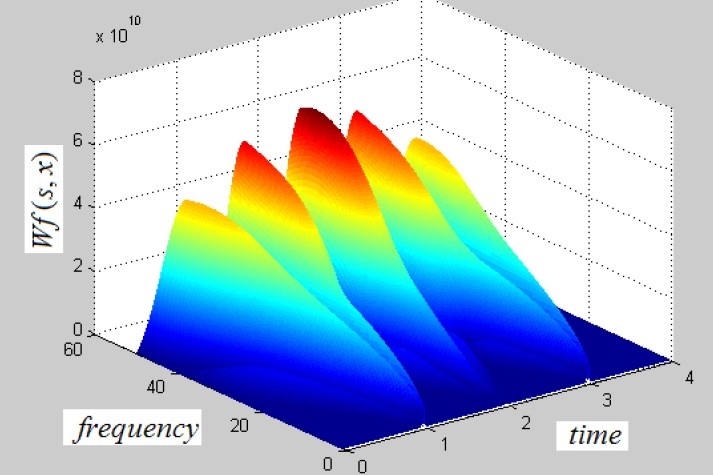
Wavelet transform of EEG
Fig 3.
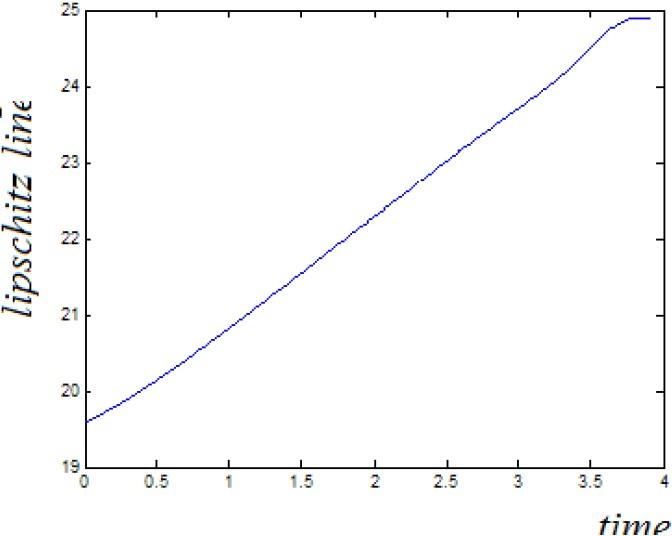
A+.5 line with m=.1.4566 and a=0.9566 so we have a=0 for determining the wavelet function.
Fig 2.
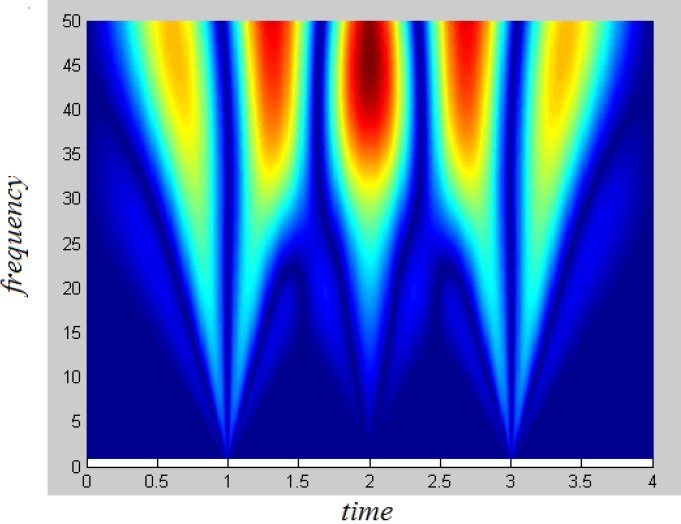
xy plane to know point of Singularites.
Noise Removal
Adaptive Wavelet Denoising has many good results in biomedical signals, and ICA has many advantages in EEG denoising. Therefore it is possible to combine them to reach the better Signal to Noise Ratios (SNR). The SNR was defined as the ratio of standard deviations of the clean ERP signal and one of the surrogate EEGs. Note that for lower SNR, the ERP are hardly recognizable in the single-trial. ICA approach helps us to use adaptive thresholding via wavelet to choose thresholds of denoising (figure 4).
Fig 4.
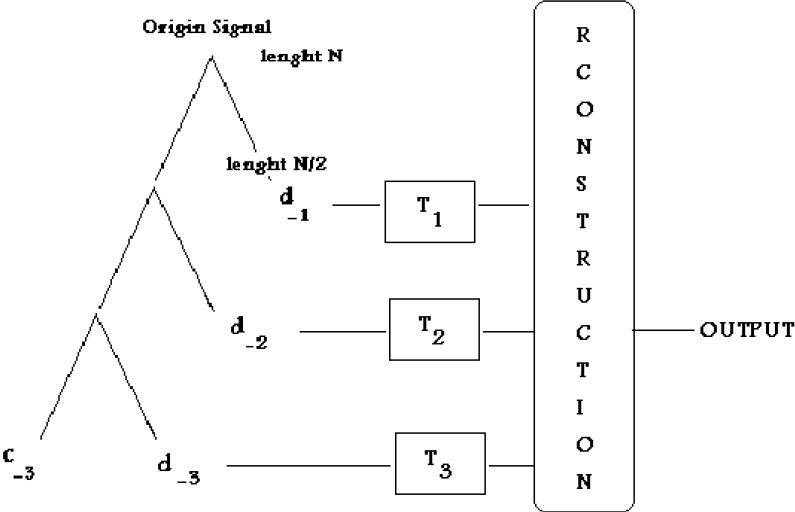
Adaptive Wavelet Thresholdings.
As shown in fig.4 adaptive wavelet denoising is a method to noise removal. Wavelet Transform computed. Then the level C−3, the lowest frequency is kept, which is more noiseless and similar to original signal. Other levels (d−n) must denoised with sufficient thresholds (such as Tn). With adaptive wavelet thresholding user can denoised each level with interested threshold and function[7].
To have WT coefficients only for singularities and no other points, a proper wavelet need to detect singularities in a signal (sufficient number of moments must be zero). EEG signal has peaks at some points, like discontinuous regions so we choose α (lipschitz Regularity) to be zero.

Now the signal has to be input of WT. because SNR of EEG is low we propose to have 3 analysis levels by soft thresholding. Usually the levels of transform can be changed (most 3 to 5) but in more practical denoising, 3 levels work well. Our experiment certify this suggestion[7,15].
Soft thresholding is a useful tool to denoising signals with low SNRs, but hard thresholding could generate more noise. It can be simply defined by[7] (figure 5):
Fig 5.
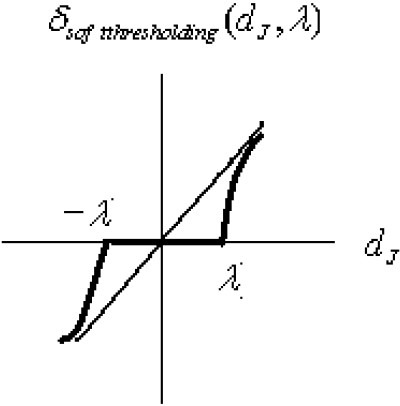
Function of δsoft thresholdnig(new) (dJ, λ).
δsof tthresholding (dJ, λ) = (dJ – signλ) II(|dJ|> λ)
where II (.) is heavyside function. (12)
dJ 's are the elements in each level of WT and λ is the threshold for denoising each element.
We change above function fewness, to have a better signal power.

where ∏(.) is heavyside function, k = 2.
By WT we have subspaces of Cz channel complex with noise. ICA separate ICs by maximizing negentropy of sources. We want to use this idea to finds proper threshold in each branch.
Fig 6.

EEG Signal Via Cz Channel in ERP
Applying some preprocessing steps before using an ICA algorithm is very useful to separate ICs. Therefore we discuss some techniques that make the ICA estimation so simpler and in better condition.
The most basic preprocessing step is to center x, i.e. to make x a zero-mean variable, subtract its mean vector m = E{x}. This process does not mean that the mean couldn’t be estimated.
We can complete the estimation of mixing matrix A with centered data, by adding the mean vector of s, back to the centered estimates of it. A−1m gives the mean vector of s (in the preprocessing m was subtracted as the mean)[13].
Whitening the observed variables is another useful preprocessing strategy in ICA. This means that after centering and before the application of the ICA algorithm, we linearly transform the observed vector X to obtain a new white vector X, i.e. its components are uncorrelated and their variances equal one. In other words, the covariance matrix of X is the identity matrix:
E{XXT}= I (14)
Using the eigen-value decomposition (EVD) of the covariance matrix E{xxT}= EDET is one of the popular method for whitening , where E is the orthogonal matrix of eigenvectors of E{xxT} and D is the diagonal matrix of its eigenvalues, D= diag(d1, …,dn)[13,22]. Note that E{xxT} can be estimated from the available sample x(1), ..,x(T). we can see that whitening can now be done by:

Where the matrix D−½ is computed by a simple component-wise operation as D−½ = diag(d1−½,…,dn−½. The mixing matrix transforms into a new one, Ã, where it is orthogonal[13,22]:

Centering and whitening prepare subspace signals to denoising. In universal denoising, the parameter has to be introduced by[7,15]:

Where in this function, δ stand for variance of noise, d−1k 's are the first subspace elements (1≤K≤N), N imply length of trail and λ is the threshold. In universal thresholding, the same threshold (above formula), used for all subbands.
But we compute negentropy for each branch. One of the subbands that has lower frequency is like to signal so its negentropy is important. Other subspace negentropies have compared to this one and their differences change the threshold of denoising. To adaptive wavelet thresholding, SURE has introduced to fine the best threshold in each band. In this approach threshold from zero to universal value changed and SURE like follow formula computed then threshold that associated minimum SURE determined and used for that band. We have improved SURE by negentropy feature. So the SURE can change like this:
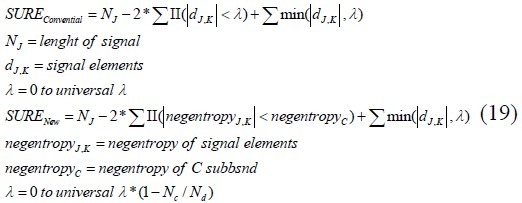
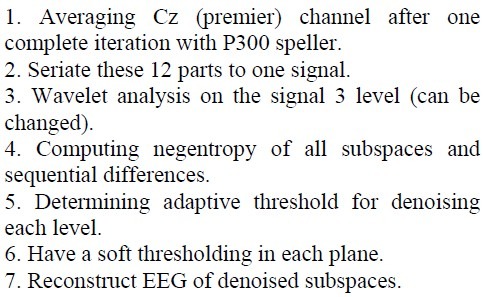
If signals to noise ratio is less so we can increase the Wavelet Transform and denoising each level accurately. But in practice the WT levels for denoising are 3 to 5[7,15]. In this application we found that 3 levels could be sufficient. So Negentropy of 3 levels wavelet decomposition from EEG were computed then each one has denoised by adaptive soft thresholding obtaind by their negentropy. These subspaces, reconstructed in time/domain transform. This approach suggests very good denoising method and SNR results.
Denoising Algorithm of EEG signals via Adaptive Wavelet Thresholding by ICA Concepts
Simulation and Results
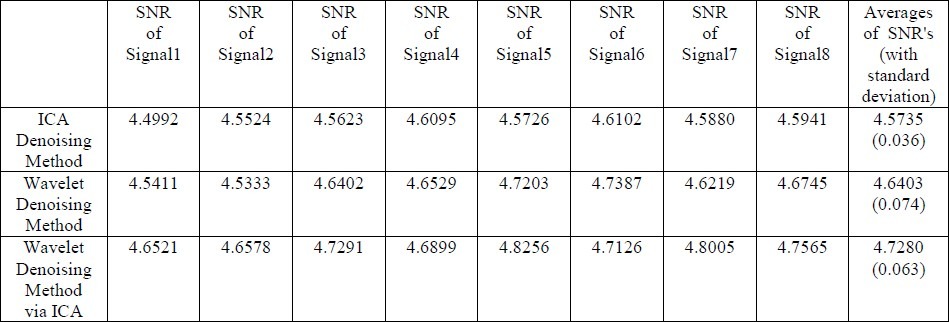
EEG signals in each iteration were averaged and 12 averaged parts let to determine ERP Eliminating artifacts caused to develope clear EEG signals. This algorithm applied on BCI Competition 2003 database (IIb) and interesting results appears. In the EEG data with average SNR of 4.4667 dB we have test ICA, Wavelet Thresholding (Soft Thresholding with Universal criteria) and Adaptive Wavelet Thresholding via ICA concepts algorithm to compare them for enhancement ERP detection. Sequentially averaged SNR=4.5933 dB, SNR=4.6700 dB and SNR=4.7442 dB obtained. therefore the proposed method could be more accurate to EEG enhancement. Some simulation results can be seen as follows.
Fig 7.
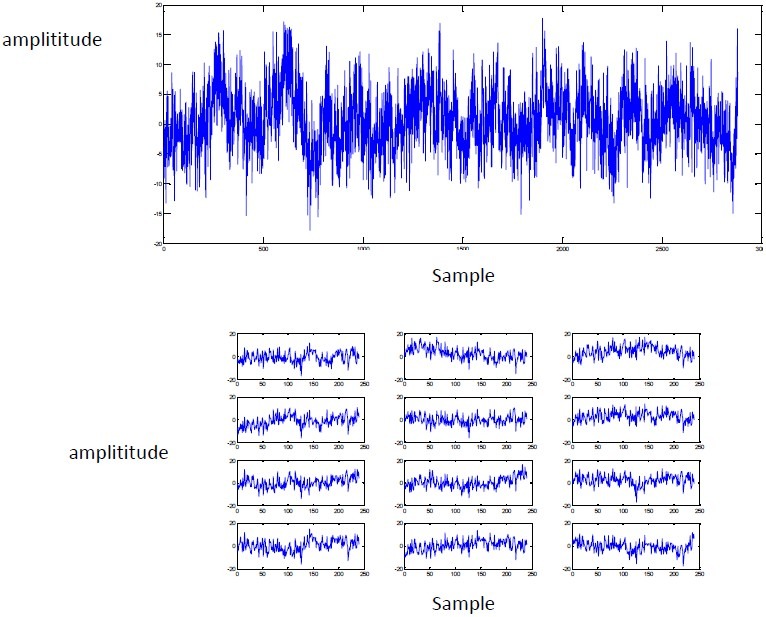
Noisy EEG of Cz Channel(Top) and it's 12 segments (Down).
Fig 8.
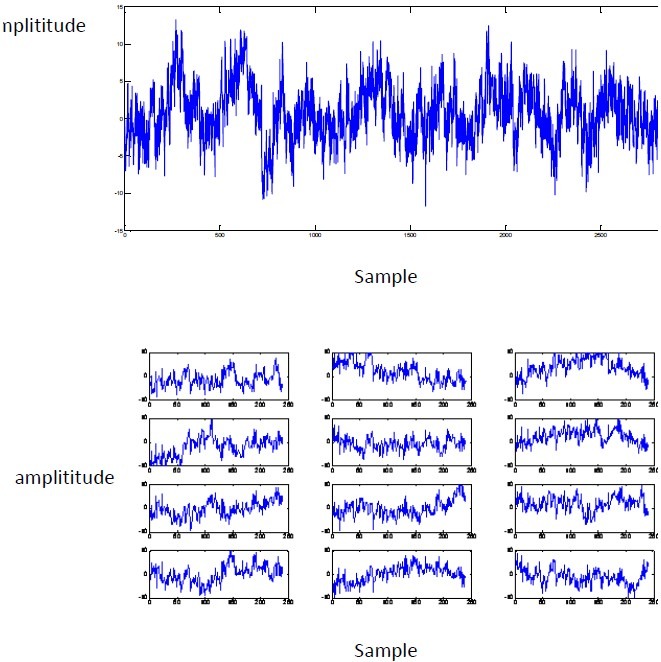
Denoised EEG of Cz Channel by ICA(Top) and it's 12 segments (Down).
Fig 9.
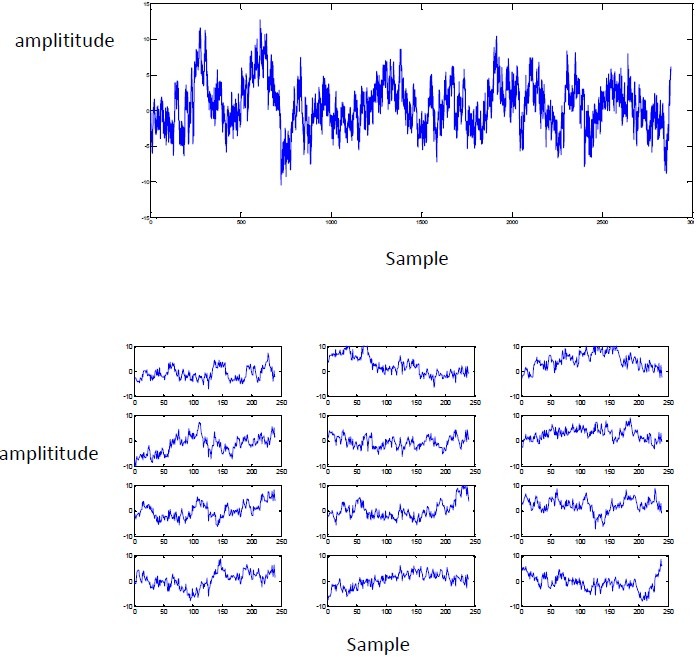
Denoised EEG of Cz Channel by Adaptive Wavelet Thesholdings (Top) and it's 12 segments(Down).
Fig 10.
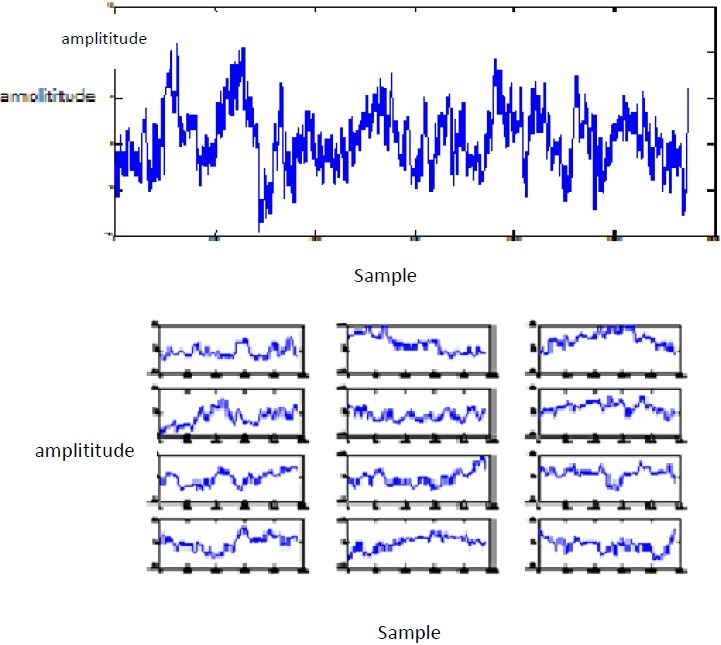
Denoised EEG of Cz Channel by Proposed Algorithm(Top) and it's 12 segments (Down).
Table 1.
Comparing different methods on achieved Signals to Noise ratios of some signals
Conclusion
This paper has introduced a new algorithm to enhance ERP signals. SNR of EEG is very low. We aim to eliminate artifacts. We proposed a method based on adaptive wavelet thresholding via ICA concepts. Negentropy is a most important feature to diagnose noises. This method was compared with two usual algorithms such as ICA and WT. Algorithms was tested on signals from dataset BCI competition 2003. The proposed method could be more accurate to EEG enhancement.
References
- 1.Delorme A., Makeig S. “An open source toolbox for analysis of single-trial EEG dynamics including independent component analysis,”. Neurosci methods. 2004;134(1):9–21. doi: 10.1016/j.jneumeth.2003.10.009. [DOI] [PubMed] [Google Scholar]
- 2.Delorme A., Makeig S. “EEG changes accompanying learned regulation of 12 Hz EEG activity,”. IEEE Trans, Neural Systems and Rehabilitation. 2003;11:133–137. doi: 10.1109/TNSRE.2003.814428. [DOI] [PubMed] [Google Scholar]
- 3.Hyvarinen A., Karhunen J. “Independent Component analysis”. Wiley, NewYork: 2001. [Google Scholar]
- 4.Quinquis A. “Few practical applications of wavelet packets source”. Digital Signal Processing, A review Journal. 1998;8(1):49–60. [Google Scholar]
- 5.Rakotomamonji A., Guigue V. “BCI COMPETITION III: Dataset II-ensemble of SVMs for BCI P300 speller,”. IEEE Trans. Biomedical Eng. 2008;55(3):1147–1154. doi: 10.1109/TBME.2008.915728. [DOI] [PubMed] [Google Scholar]
- 6.Blankertz B., Müller K.-R., Curio G., Vaughan T. M., Schalk G., Wolpaw J. R., Schlögl A., Neuper C., Pfurtscheller G., Hinterberger T., Schröder M., Birbaumer N. “The BCI Competition 2003: Progress and Perspectives in Detection and Discrimination of EEG Single Trials”. IEEE Trans. Biomed. Eng. 2004 Jun;51(6):1044–1051. doi: 10.1109/TBME.2004.826692. [DOI] [PubMed] [Google Scholar]
- 7.Donho D.L. “De-noising by soft thresholding,”. IEEE Trans. Information theory. 1995;41(3) [Google Scholar]
- 8.Lemire D., Pharand C., Rajaonah J.C. “Wavelet time entropy T wave morphology and myocardial ischemia,”. IEEE Trans, Biomedical eng. 2000;47(7):967–970. doi: 10.1109/10.846692. [DOI] [PubMed] [Google Scholar]
- 9.Gouy-Pailler Cédric, Congedo Marco, Jutten Christian, Brunner Clemens, Pfurtscheller Gert. EURASIP. Switzerland: Lausanne; 2008. Aug, Model-based source separation for multi-class motor imagery. In Proceedings of the 16th European Signal Processing Conference (EUSIPCO-2008) [Google Scholar]
- 10.Donchin E., Spencer K., Wijesinghe R. “The mental prosthesis: assessing the speed of a P300-based brain-computer interface,”. IEEE Trans. Rehabil. Eng. 2000 Jun;8(2):174–179. doi: 10.1109/86.847808. [DOI] [PubMed] [Google Scholar]
- 11.Donchin E., Spencer K., Wijesinghe R. “The mental prosthesis: Assessing the speed of a P300-based brain computer interface”. IEEE Trans. Rehabilitation Eng. 2009;8:174–179. doi: 10.1109/86.847808. [DOI] [PubMed] [Google Scholar]
- 12.Donchin E., Arbel Y. “P300 based brain computer interface: A progress report,”. Lecture Notes in computer Science. 2009;5638:724–731. [Google Scholar]
- 13.Nezhadarya E., Shamsollahi M. B. “EOG Artifact removal from EEG using ICA and ARMAX modeling,”. Proc. of the 1st UAE Int. Conf. of the IEEE BMP. 2005 Mar 27-30;:145–149. [Google Scholar]
- 14.Al-Nashah H.A., Paul J.S. “Wavelet entropy method for EEG application to global brain injury,” proceeding of the 1st international IEEE EMBS. Neural Systems and Rehabilitation. 2003:348–352. [Google Scholar]
- 15.Blaszezuk J., Pozorski Z. “Application of the lipschitz exponent and the wavelet transform to function discontinuity estimation,”. Institute of Mathematics and Computer Science. 2007 [Google Scholar]
- 16.Wolpaw J. R., Birbaumer N., McFarland D. J., Pfurtscheller G., Vaughan T. M. “Brain-computer interfaces for communication and control”. Clinical Neurophysiology. 2002;113(6):767–791. doi: 10.1016/s1388-2457(02)00057-3. [DOI] [PubMed] [Google Scholar]
- 17.J. Goswami, Jaideva T. “Fundamentals of Waveletes theory, Algorithms and application”. Wiley Series in Microwave and Optical Engineering. 1999 [Google Scholar]
- 18.Farwell L., Donchin E. “Talking off the top your head toward a mental prosthesis utilizing event-related brain potentials,”. Electgron eephaloge Clin neurophys. 1988;70:510–523. doi: 10.1016/0013-4694(88)90149-6. [DOI] [PubMed] [Google Scholar]
- 19.Hochberg L. R., Serruya M. D., Friehs G. M., Mukand J. A., Saleh M., Caplan A. H., Branner A., Chen D., Penn R. D., Donoghue J. P. “Neuronal ensemble control of prosthetic devices by a human with tetraplegia,”. Nature. 2006 Jul;442(7099):164–171. doi: 10.1038/nature04970. [DOI] [PubMed] [Google Scholar]
- 20.Lucia M., Firtchy J. “A novel method for automated classification of epileptiform activity in the human electroencephalogram-based on independent component analysis”. Med. Biomedical Eng. 2008;46(3):263–272. doi: 10.1007/s11517-007-0289-4. [DOI] [PubMed] [Google Scholar]
- 21.Milanesi M., Martini N. “Independent component analysis applied to the removal of motion artifacts from electrocardiographic signals,”. Med Biol Eng Comput. 2008;46(3):251–261. doi: 10.1007/s11517-007-0293-8. [DOI] [PubMed] [Google Scholar]
- 22.Xu N., Gao X., Hong B., Miao X., Gao S., Yang F. “BCI Competition 2003-Data Set IIb: Enhancing P300 Wave Detection Using ICA-Based Subspace Projections for BCI Applications,”. IEEE Trans. Biomed. Eng. 2004 Jun;51(6):1067–1072. doi: 10.1109/TBME.2004.826699. [DOI] [PubMed] [Google Scholar]
- 23.Quian R., Rosso O.A. “Wavelet entropy in event-related potentials- a new method shows ordering of EEG oscillations,”. Biological Cybernetics. 2001;84:291–299. doi: 10.1007/s004220000212. [DOI] [PubMed] [Google Scholar]
- 24.Jung T.-P., Makieg S., Humphries C., Lee T.-W., Mckeown M. J., Iragui V., Sejnowski T. J. “Removing electroencephalograohic artifacts by blind source separation,”. Psycophysiology. 2000;37:163–178. [PubMed] [Google Scholar]
- 25.Wiklund U., Karlsson U. “Adaptive spatio-temporal filtering of disturbed ECG's: A multichannel approach to heart-beat detection in smart clothing,”. Med Biol Eng Comput. 2007;45(6):515–523. doi: 10.1007/s11517-007-0183-0. [DOI] [PubMed] [Google Scholar]
- 26.Tang Y., Yang L. “Characterisation and detection of edges by lipschitz exponetnts and MASW wavelet transform,”. 2007 [Google Scholar]


