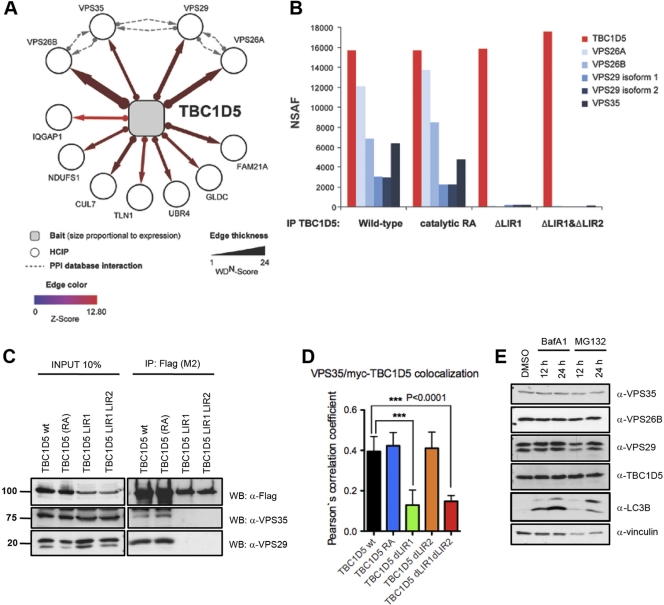
Fig 3.
TBC1D5 requires LIR1 to bind to the retromer. (A) Proteomic analysis of TBC1D5. The association map shows identified HCIPs. The dashed lines indicate interactions annotated in the BIOGRID, MINT, and HPRD protein interaction databases. (B) Proteomic analysis of TBC1D5. Immune complexes from cells expressing wild-type and catalytic RA and ΔLIR mutant TBC1D5 proteins were subjected to IP–LC–MS-MS. Normalized spectral abundance factors (NSAF) were calculated based on total spectral counts (41). (C) Validation of TBC1D5-associated proteins. Expression of HA-Flag-tagged wild-type TBC1D5, TBC1D5 RA, TBC1D5 ΔLIR1, or TBC1D5 ΔLIR1 ΔLIR2 was induced in stable TREx293 cells for 24 h. Cell lysates were immunoprecipitated with Flag M2-coupled resin and immunoblotted with anti-Flag and anti-Vps29 antibody, respectively. Units for numbers (left) are kDa. (D) Immunofluorescence of endogenous Vps35 and transiently expressed myc-tagged TBC1D5 (wild type [wt], TBC1D5 RA, TBC1D5 ΔLIR1, TBC1D5 ΔLIR2, and TBC1D5 ΔLIR1 ΔLIR2) in HeLa cells. Colocalization of more than 100 cells was quantified in 3 independent experiments for each TBC1D5 construct using Volocity Demo software, and a paired t test was performed using GraphPad Prism. The error bars indicate SD. (E) Abundance of endogenous TBC1D5, MAP1LC3, and retromer subunits VPS35, VPS26B, and VPS29 in HeLa cells 12 and 24 h after treatment with BafA1 (100 nM) and MG132 (10 μM).

