
Fig 1.
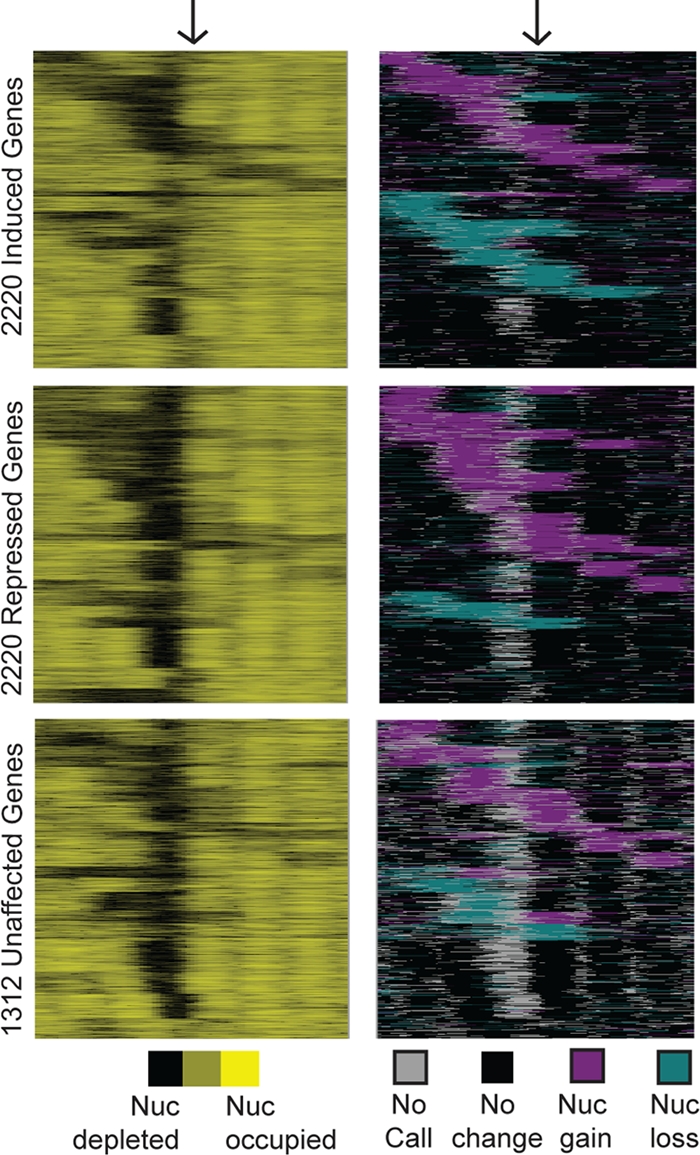
Global analysis of nucleosome positions before and after stress. Genes were subdivided into groups with induced (top), repressed (middle), and unchanging (bottom) expression. Each group was organized separately by k-means clustering based on concatenated data representing nucleosome positions before stress (counts/base pair; left panels) and the position of nucleosome gain (magenta) or depletion (aqua) observed at one or more time points (right panels). Each row represents 500 bp upstream and downstream of a TSS (indicated with arrows), with nucleosome occupancy shown in black or yellow and the directionality of nucleosome change (without regard to timing) shown in magenta or aqua, according to the keys. Data were smoothed with a sliding average based on a 20-bp window with a step size of 10 bp.