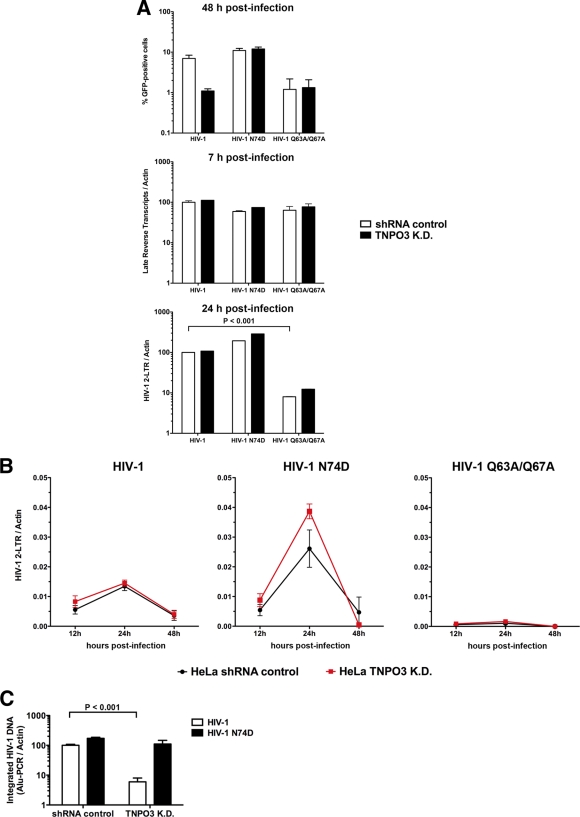
Fig 1.
TNPO3-deficient cells block HIV-1 infection after nuclear import but prior to integration. (A) HeLa TNPO3 K.D. cells (TNPO3 K.D.) and HeLa cells transduced with the empty vector pLKO.1 (shRNA control) were challenged with DNase-pretreated HIV-1-GFP, HIV-1-N74D-GFP, and HIV-1-Q63A/Q67A-GFP as indicated. Infection was determined by measuring the percentage of GFP-positive cells by flow cytometry 48 h postinfection (upper panel). In parallel, cells from similar infections were lysed at 7 and 24 h postinfection and total DNA was extracted. The DNA samples collected at 7 h postinfection were used to determine the levels of late reverse transcripts by real-time PCR (middle panel). HIV-1 2-LTR circles were quantified by real-time PCR in DNA samples collected at 24 h postinfection (lower panel). Late reverse transcripts and 2-LTR circle levels were normalized on a per-cell basis relative to HeLa shRNA control cells infected with HIV-1. (B) Similarly, TNPO3 K.D. and shRNA control cells were infected by HIV-1-GFP, HIV-1-N74D-GFP, and HIV-1-Q63A/Q67A-GFP normalized by quantifying particle-associated reverse transcriptase activity on viral supernatants. At 12, 24, and 48 h postinfection, total DNA was extracted and used to determine the levels of HIV-1 2-LTR circles. (C) DNA extracted at 24 h was also used to determine integration into the genome by measuring integrated proviruses using real-time Alu-PCR products relative to HeLa shRNA control cells infected with HIV-1; Alu-PCR products are achieved by using primers complementary to the HIV LTR U3 region and chromosomal Alu repeats. Similar results were obtained in three independent experiments, and standard deviations are shown. Statistical differences were given as P values of <0.001 by two-way analysis of variance (ANOVA) followed by the Bonferroni post test.

