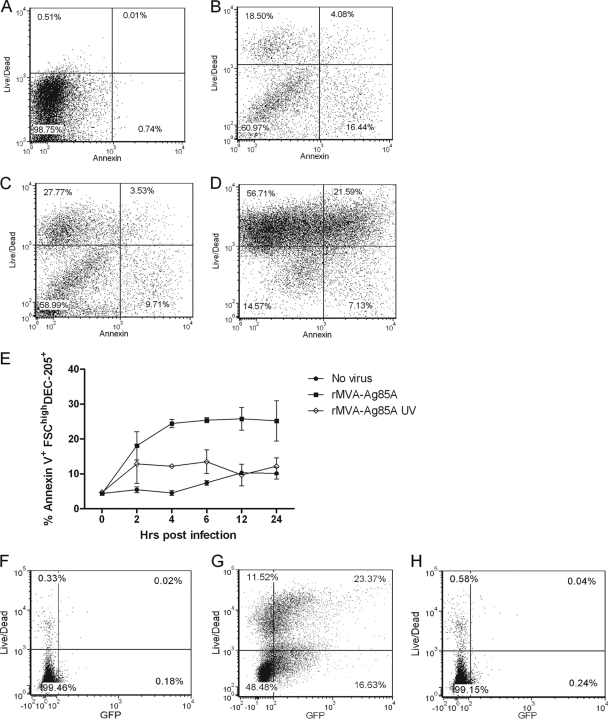
Fig 2.
rMVA induces apoptosis in ALDC shortly after infection. ALDC were infected with rMVA-Ag85A or UV-inactivated virus at 4°C for 60 min to allow virus attachment; excess virus was removed by extensive washing, and cells were cultured at 37°C. Aliquots were then harvested at various time points, and apoptosis was measured using annexin V and LIVE/DEAD stain by flow cytometry. (A to D) Annexin V-LIVE/DEAD dot plots showing apoptosis before infection and at 30 min, 2 h, and 24 h postinfection within gated DEC205hi ALDC. (E) Line graph showing the frequency of apoptotic ALDC after rMVA infection (black squares) compared with UV-inactivated rMVA (white diamonds) and mock-infected cells (black circles). Points indicate means of results from cells from 5 individual animals analyzed in duplicate, and error bars indicate standard deviations. (F to H) Dot plots showing GFP expression in MVA-infected cells. ALDC were mock infected (F) or infected with rMVA-GFP (G) or with UV-inactivated rMVA-GFP (H) as described above. Cell death and GFP expression in gated DEC205hi ALDC were measured after 6 h by flow cytometry. Plots are representative of five individual experiments.

