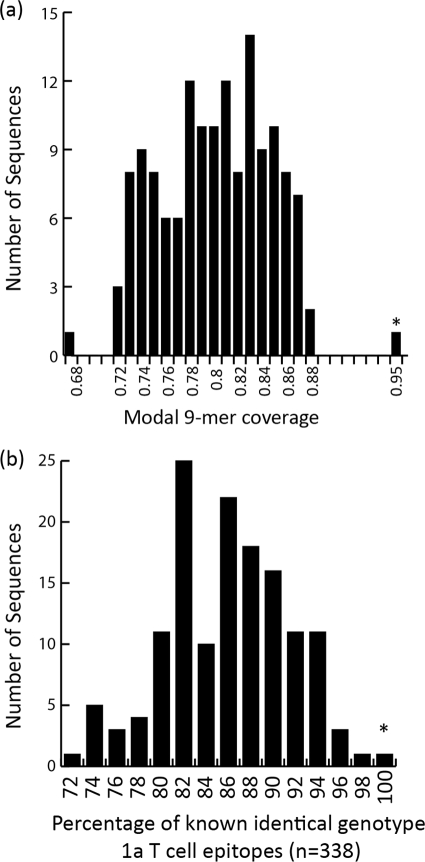
Fig 3.
Bole1a (indicated by an asterisk) is highly representative based on coverage of modal (most commonly observed) 9-mers provided by Bole1a and all other sequences in the Yusim data set (a) and identity to known epitopes, depicted as a histogram showing the percentages of epitope sequences that are identical to those of the known and common 338 T cell epitopes (b).

