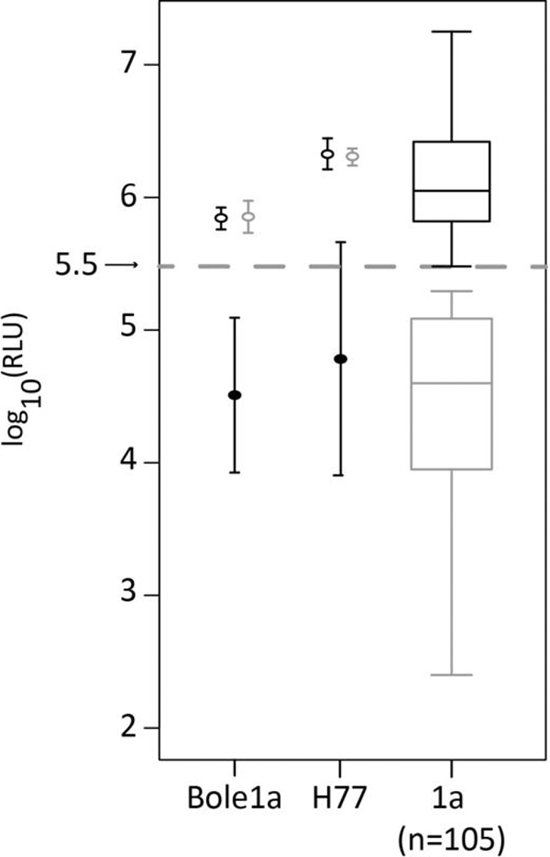
Fig 4.

The infectivity of various HCVpp is shown in log10 (RLU). The gray dashed line represents the RLU threshold for infectious HCVpp. The open black circles in the first two columns represent average infectivities without any antibodies. The filled black circles show average infectivities in the presence of anti-CD81, and the open gray circles show infectivity in the presence of an isotype control. The error bars show the standard deviations calculated from 3 separate experiments. The black and gray boxplots on the right show the distributions of infectivity without antibody of all infectious and noninfectious subtype 1a HCVpp, respectively.
