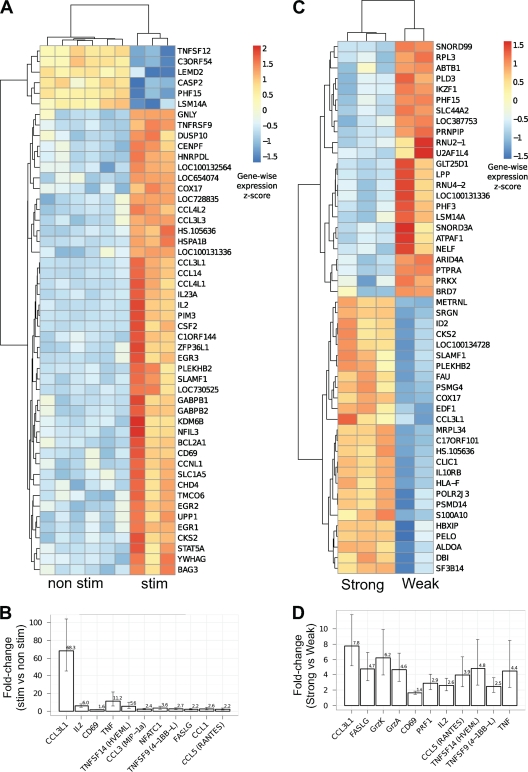
Fig 2.
CM9-specific EM CD8+ T cells with strong VIA exhibit a transcriptional profile distinct from that of cells with weak VIA. (A) Heat map representation of the expression values for the top 50 (FDR estimated at 0.09%) genes that are most significantly differentially expressed between nonstimulated CM9-specific EM CD8+ T cells (n = 6) and stimulated CM9-specific EM CD8+ T cells (n = 3). Rows represent genes, and columns represent samples. Colors correspond to the value of the within-gene (row) standard score. (B) Relative (stim versus nonstim) expression levels of stimulated CM9-specific EM CD8+ T cells for a selection of 11 functionally relevant genes. All genes meet the requirement of a P value of <0.005 and are found at a 5% FDR except for FASLG (9%), CCL1 (17%), and CCL5 (22%). Panels C and D are the same as panels A and B except that they show the comparison between stimulated CM9-specific EM CD8+ T cells with strong VIA (n = 2) and stimulated CM9-specific EM CD8+ T cells with weak VIA (n = 3). The FDR in panel C is estimated at 0.3%. Selected genes in panel D meet the requirement of a P value of <0.003 and are found at 5% FDR except for TNFSF14 (7%), TNFSF9 (10%), and TNF (12%).

