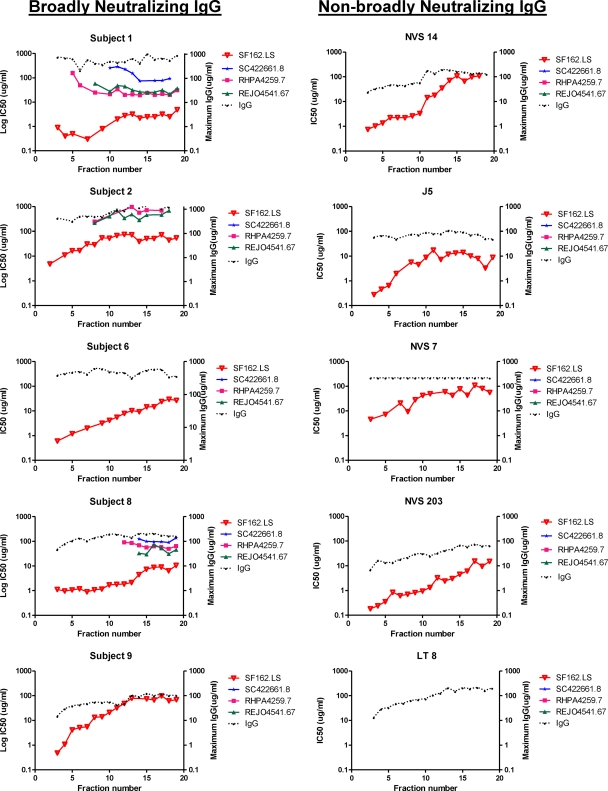
Fig 4.
Neutralization patterns of IEF-fractioned IgG from subjects with broad or nonbroad plasma HIV neutralizing activity. IEF fractions are indicated on the x axis; the pH gradient of 6.5 to 9.5 spans the fractions from left to right. IgG from each fraction was tested for neutralizing activity against the indicated pseudoviruses as described in Materials and Methods. SF162.LS is a tier 1 pseudovirus; the rest fall within the tier 2 category. Assays were run in duplicate. Mean infectivity values were used to calculate IC50 titers (left y axis). The maximum IgG concentrations tested per fraction are shown on the right y axis. The absence of a symbol for any pseudovirus-fraction pair indicates that an IC50 was not achieved at the highest testable IgG concentration in the fraction.

