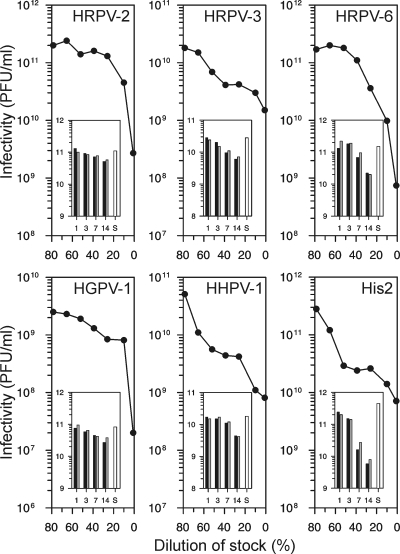
Fig 2.
Salt dependence of viral infectivity. The virus stocks were diluted in 50 mM Tris-HCl (pH 7.2), and infectivity was determined after 1 day of incubation at 4°C. The x axis indicates the proportion of the stock in the dilution mixture. The insets show the stability of the viruses in optimal SW buffer (black bars) and in 23% SW (gray bars). The virus stocks were diluted 1:1,000 in the buffers, and infectivity was determined after 1, 3, 7, and 14 days of incubation at 4°C. The white bars indicate the titers of the starting material (S). The scale of the y axis in the insets is the logarithm of infectivity (PFU ml−1).

