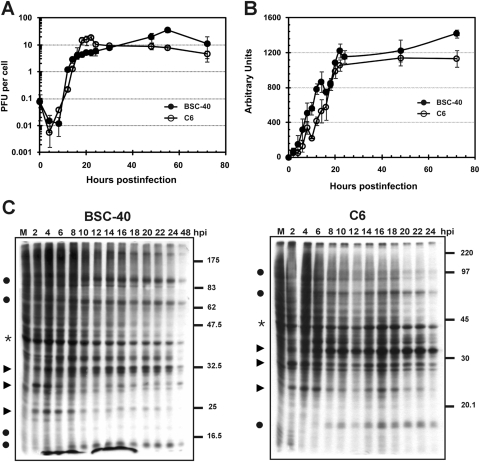
Fig 3.
Time course analysis of progeny production, DNA replication, and protein synthesis in COTV-infected cells. Semiconfluent BSC-40 and C6 monolayers were infected with COTV at an MOI of 1, and at the indicated times postinfection, cells were either harvested for virus titration by plaque assay (A), processed for detection of viral DNA by slot blot hybridization (B), or pulse-labeled with [35S]methionine followed by 12% SDS-PAGE analysis (C). (A) Values represent the means for three assays titrated in duplicate. (B) The autoradiograms obtained for BSC-40 and C6 cells were scanned, and densitometry analysis was performed. The numbers (arbitrary units) express the mean values for nine autoradiograms in which samples were applied in triplicate. (C) Representative autoradiograms are shown. Filled circles indicate viral late proteins; arrowheads indicate viral early proteins; asterisks indicate a host protein. M, mock-infected cells. Molecular size markers (in kilodaltons) are given on the right.

