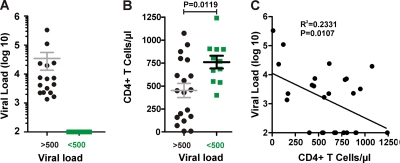
Fig 1.
Viral loads and CD4+ T cell counts of study subjects. Viral loads (A) and CD4+ T cell counts (B) in HIV-2-infected individuals at the time of PBMC or plasma sampling for nef analysis. Patient samples were grouped based on their VLs (above or below the detection limit of 500 viral RNA copies per ml plasma) and are color coded: black, viremic; green, nonviremic. The horizontal bars indicate average numbers per group. (C) Correlation between the VLs and the CD4+ T cell counts.

