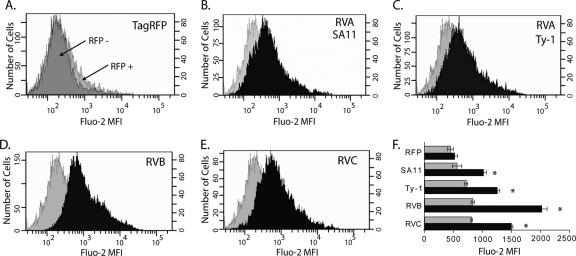
Fig 8.
Elevation of cytoplasmic calcium by NSP4 from RVA, RVB, and RVC. (A) Population histograms for TagRFP-negative (dark gray) and TagRFP-positive (light gray) cells. (B to E) Representative population histogram of TagRFP-positive cells (gray) compared to a representative population histogram of NSP4-RFP-positive cells (black) for NSP4 from the indicated rotavirus. The x axis shows the mean fluorescent intensity of the Ca2+ indicator Fluo-2. The left and right y axes show the number of cells for the NSP4-RFP-positive and TagRFP-positive populations, respectively. (F) The Fluo-2 MFIs of RFP-negative (gray) and RFP-positive (black) populations from three independent experiments are graphed. Error bars represent standard deviations. *, P < 0.01 for TagRFP-positive versus individual NSP4-RFP-positive populations.

