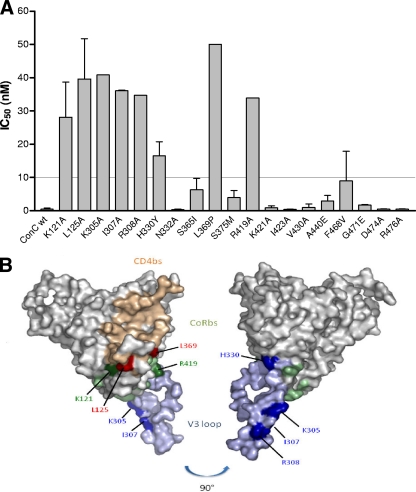
Fig 4.
(A) Neutralization of ConC gp120 single-point mutants with UCLA1. Graph depicts the IC50s of the mutants with those above the dotted line conferring resistance (≥10 nM). wt, wild type. (B) Structural representation of the amino acid residues involved in UCLA1 neutralization resistance. Blue depicts the V3 loop, green depicts the CoRbs, and tan depicts the CD4bs. Residues causing neutralization escape are marked in dark shades of the corresponding region. The picture was rotated at 90° for a clear view of the H330 and R308 residues. Coordinates were taken from the structure of the gp120JRFL core with V3 ligated with CD4 and X5 (Protein Data Bank accession no. 2B4C). The figure was generated with PyMOL (DeLano Scientific LLC, South San Francisco, CA [http://www.pymol.org]).

