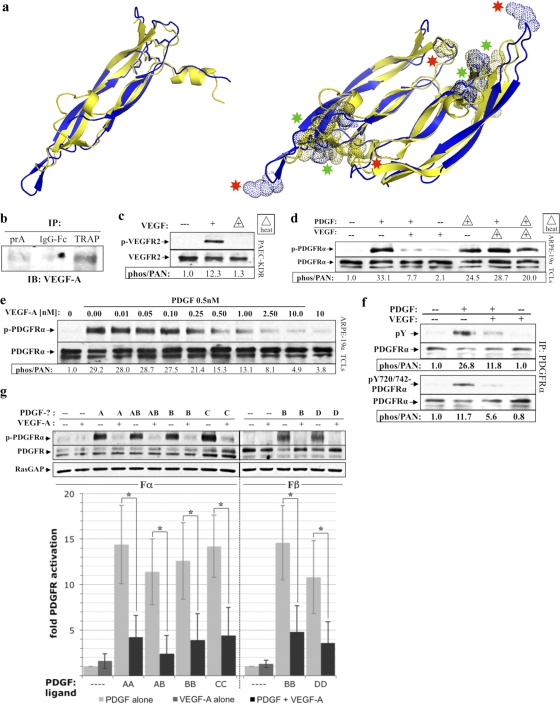
Fig 3.
VEGF-A was present in PVR vitreous and inhibited PDGF-dependent activation of PDGFRα. (a) Ribbon structural alignments of human PDGF-B (blue) and human VEGF-A (yellow) crystal structures. Monomers (left) superimpose with a root mean square (RMS) deviation from ideal geometry of 1.7 Å, and dimers (right) superimpose with an RMS deviation of 1.9 Å, indicating that the dimerization modes and overall conformations are very similar (49). Dotted spheres shown on the aligned dimer structures (right) depict areas where the color-matched ligand is thought to make important contacts with its cognate receptor. Both ligands share an equivalent receptor-binding face (depicted above the plane of the paper) containing substantial areas of overlap in their respective receptor-binding regions (green asterisks), as well as receptor-binding regions unique to each ligand (red asterisks). Crystal structures were obtained from PDB depositions of human PDGF-B resolved to 3 Å with accession code 1PDG (51), and human VEGF-A resolved to 1.93 Å with accession code 2VPF (49). Structural alignments were performed using PYMOL software. (b) VEGF-A was recoverable from PVR vitreous using the extracellular domain of PDGFRα. Protein A-agarose (PrA) alone or PrA loaded with either the IgG-Fc fragment (2 μM) or TRAP (2 μM) was incubated with RV-PVR overnight. The matrix was washed extensively, and the retained proteins were eluted with sample buffer and subjected to anti-VEGF-A Western analysis. (c) VEGF's ability to activate VEGFR2 was heat labile. PAE cells overexpressing VEGFR2 (PAE/KDR) were cultured and starved as described for ARPE-19α (Fig. 1). The cells were treated with DMEM alone (—) or 0.5 nM VEGF-A that was unheated (+) or heat treated (+ with triangle outline) to 90°C for 5 min and then rapidly cooled on ice. After treatment for 10 min at 37°C, the cells were lysed and subjected to Western analysis with anti-phospho-VEGFR2 and anti-VEGFR2. The phospho-VEGFR2 immunoblot signal was normalized to the total VEGFR2; the results are presented as the fold induction over the nonstimulated control. (d) VEGF-A-mediated inhibition of PDGF-dependent activation of PDGFRα was heat labile. ARPE-19α cells were cultured and starved as described for Fig. 1. The cells were treated with DMEM alone (—), 0.5 nM PDGF-A, 0.5 nM VEGF-A, or both 0.5 nM PDGF-A and 0.5 nM VEGF-A for 10 min at 37°C. Samples indicated by triangles were heat treated and then rapidly cooled on ice. After treatment, the cells were lysed and subjected to Western analysis with anti-phospho-PDGFRα and anti-PDGFRα. Heat treatment eliminated VEGF-A's ability to inhibit PDGF-mediated activation of PDGFRα. (e) PDGF-mediated activation of PDGFRα was inhibited by VEGF-A. The indicated concentrations of VEGF-A were added to DMEM containing 0.5 nM PDGF-A or to DMEM alone. ARPE-19α cells, prepared as described in the legend of Fig. 1, were treated with the resulting solutions for 10 min at 37°C, lysed and analyzed by Western analysis as in Fig. 1. The fold induction values of PDGFRα activation are given below the blot. The results from three independent experiments revealed that VEGF-A and PDGF-A had similar affinities for PDGFRα. 0.5 nM PDGF is 14 ng/ml; 0.5 nM VEGF-A is 19 ng/ml. (f) VEGF-A inhibited global tyrosine phosphorylation of PDGFRα. Serum-starved ARPE-19α at 75% confluence was treated with DMEM alone (—), 0.5 nM PDGF-A, 0.5 nM VEGF-A, or both 0.5 nM PDGF-A and 0.5 nM VEGF-A for 10 min at 37°C. After treatment, the cells were lysed, and the clarified lysates were immunoprecipitated using anti-PDGFRα, followed by Western analysis with antibodies against PDGFRα, all phosphotyrosines on PDGFRα (pY), or a combination of antibodies against specific PDGFRα phospho-sites at Y720 and Y742 (pY720/742-PDGFRα). Phospho-PDGFRα immunoblot signals were normalized to total PDGFRα; the results are presented as the fold induction over the nonstimulated control for each pair. (g) VEGF-A competed with all PDGF isoforms for activation of their respective PDGFRs. Serum-starved cells that exclusively expressed either PDGFRα (Fα) or PDGFRβ (Fβ) were treated for 10 min at 37°C with either DMEM (—) or a 0.5 nM concentration of the indicated PDGF isoform in the absence or presence of equimolar amounts of VEGF-A (0.5 nM). After treatment, the cells were lysed, and the resulting TCLs were subjected to Western analysis with antibodies against phospho-PDGFR (anti-pTyr720 and pTyr742 for PDGFRα; anti-pTyr751 and pTyr857 for PDGFRβ), followed by anti-PDGFR(α or β) and anti-RasGAP to normalize protein loading. Immunoblot signals were quantified as described in Fig. 1. The bar graph underneath shows the mean percent inhibition ± the SD of PDGFRα and PDGFRβ activation observed for three independent experiments (*, P < 0.05 using a paired t test). Light gray bars represent DMEM or PDGF treatment in the absence of VEGF-A, dark gray bars represent VEGF-A (0.5 nM) treatment alone, and black bars represent PDGF treatment in the presence of 0.5 nM VEGF-A. These data indicate that VEGF-A comparably inhibited all PDGF isoforms from activating their respective PDGFR(s).

