Fig 5.
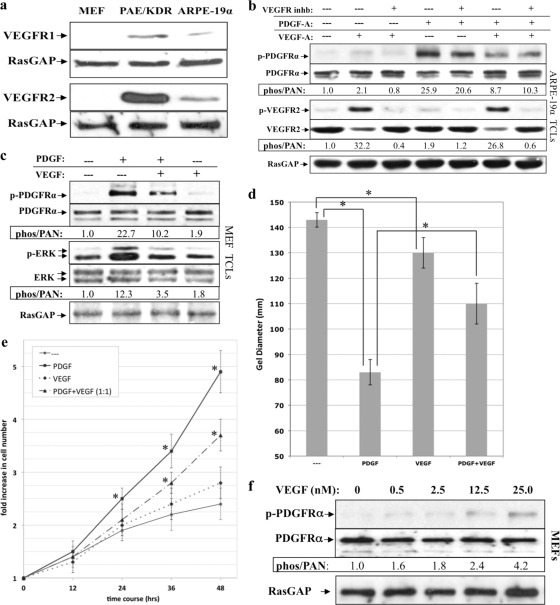
VEGF-A antagonized PDGFRα and PDGF-driven cellular response without engaging VEGFRs. (a) Expression of VEGFR1 and VEGFR2 in MEFs, PAE/KDR, and ARPE-19α cells. MEFs, PAE/KDR, and ARPE-19α cells were cultured in 10% serum to near confluence, lysed, and subjected to Western analysis using anti-VEGFR1, anti-VEGFR2, and anti-RasGAP. MEFs express neither VEGFR isoform, whereas PAE/KDR and ARPE-19α cells express both VEGFR1 and VEGFR2. (b) VEGFR kinase activity was not required for VEGF-A-dependent inhibition of PDGF-driven PDGFRα activation. ARPE-19α cells were cultured and starved as described in Fig. 1. The cells were either left untreated or treated for 10 min with different combinations of PDGF-A (0.5 nM) and VEGF-A (0.5 nM) in either the presence or the absence of a VEGFR tyrosine kinase inhibitor (VEGFR inhb), which was added 30 min prior to treatment, and used at a concentration sufficient to neutralize both VEGFR isoforms (360 nM). After treatment for 10 min at 37°C, the cells were lysed and subjected to Western analysis with anti-phospho-PDGFRα, anti-PDGFRα, anti-phospho-VEGFR2, and anti-VEGFR2. Phospho-PDGFRα and phospho-VEGFR2 immunoblot signals were normalized to total PDGFRα and VEGFR2, respectively; the results are presented as the fold induction over the nonstimulated control for each pair. RasGAP was used to assess equal loading of the protein. These data show that VEGFR kinase does not contribute to VEGF's ability to inhibit PDGF-mediated activation of PDGFRα. (c) VEGF inhibited PDGF-driven activation of PDGFRα and PDGFRα-mediated signaling events. Serum-starved MEFs at 75% confluence were treated with DMEM alone (—), 0.5 nM PDGF-A, 0.5 nM VEGF-A, or both 0.5 nM PDGF-A and 0.5 nM VEGF-A for 10 min at 37°C. After treatment, the cells were lysed and subjected to Western analysis with anti-phospho-PDGFRα, anti-PDGFRα, anti-phospho-Erk, and anti-Erk. Phospho-PDGFRα and phospho-Erk immunoblot signals were normalized to total PDGFRα and Erk, respectively; the results are presented as the fold induction over the unstimulated control for each pair. RasGAP was used to assess equal loading of the protein. (d) VEGF-A inhibited PDGF-driven PDGFRα-mediated cell contraction. MEFs were subjected to the collagen gel contraction assay in the presence of DMEM (—), 0.5 nM PDGF-A, 0.5 nM VEGF-A, or both PDGF-A (0.5 nM) and VEGF-A (0.5 nM). The gel diameter was measured manually at day 2, and the data presented are the means of three independent experiments ± the SD (shown as error bars; *, P < 0.05 using a paired t test). (e) VEGF-A inhibited PDGF-driven PDGFRα-mediated proliferation. Equal numbers of MEFs (105) were seeded on plates and grown to 50% confluence, after which serum-containing media was replaced with DMEM alone or DMEM supplemented with 0.5 nM PDGF-A (PDGF), 0.5 nM VEGF-A (VEGF), or both 0.5 nM PDGF-A and 0.5 nM VEGF-A (PDGF+VEGF). The cells were grown for up to 48 h at 37°C, and the medium was replaced every 24 h with fresh treatment. At the time points indicated, cells from each treatment were counted by hemocytometry. The graph presents data from three independent experiments showing the fold increase in cell number (means ± the SD) normalized to the number of cells initially seeded (*, P < 0.05 using a paired t test relative to no-treatment controls at the indicated times). (f) VEGF-A-mediated activation of PDGFRα. The indicated concentrations of VEGF-A were added to serum-starved MEFs at 75% confluence for 10 min at 37°C. The cells were lysed, and the resulting TCLs were subjected to the same Western analysis and quantification as described in Fig. 1. The fold induction values of PDGFRα activation are given below the blots. A concentration of 25 nM VEGF-A corresponds to 955 ng/ml.

