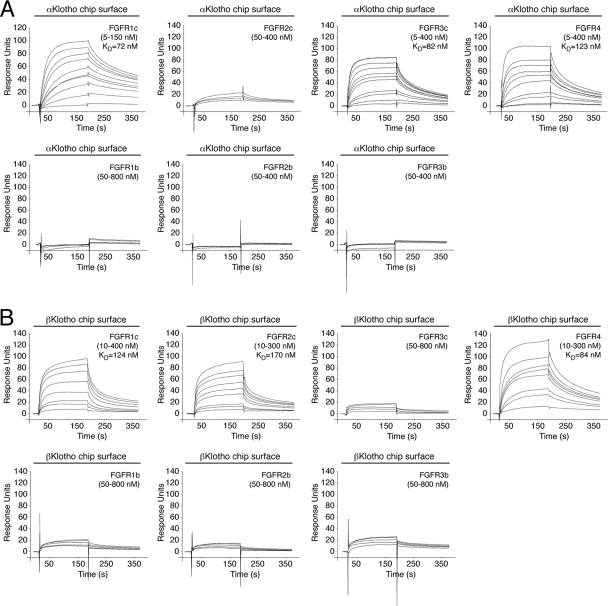
Fig 5.
Comprehensive analysis of FGFR binding specificity of Klotho coreceptors. (A and B) Overlays of SPR sensorgrams illustrating the FGFR binding specificity profile of αKlotho (A) and βKlotho (B). The ectodomains of αKlotho and βKlotho were immobilized on a biosensor chip, and increasing concentrations of the ligand-binding domain of each of the seven principal FGFRs were passed over the chip. Where possible, equilibrium dissociation constants (KDs) were derived from fitted saturation binding curves. The data are representative of two to five independent experiments. To give a complete view of the FGFR binding specificity of Klotho coreceptors, the sensorgrams illustrating βKlotho binding to FGFR1c and FGFR4 from Fig. 1 are shown again in panel B of this figure.

