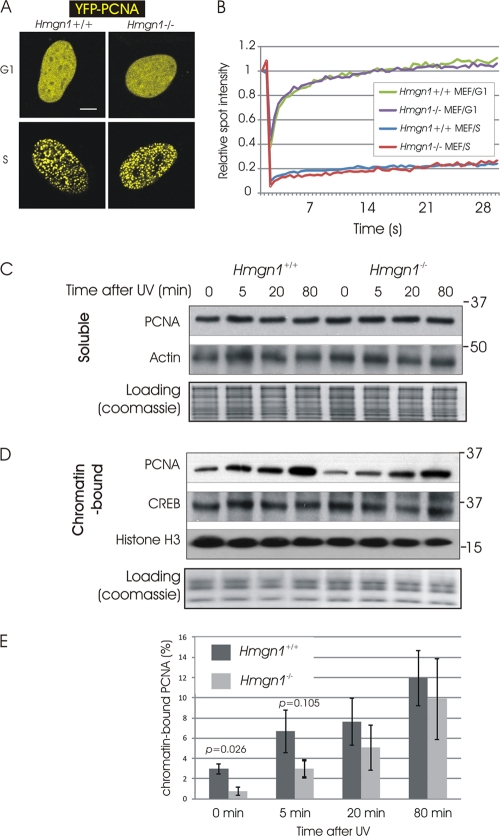
Fig 5.
(A) Organization of PCNA in mouse embryonic fibroblasts during G1/G2 and S. Shown are confocal images of cells expressing YFP-PCNA. (B) FRAP analysis of PCNA at G1/G2 and S in Hmgn1−/− and Hmgn1+/+ MEFs. (C) Western analysis of the effects of DNA damage on the levels of soluble (non-chromatin-bound) PCNA in Hmgn1−/− and Hmgn1+/+ MEFs. (D) Western analysis of the effects of DNA damage on the levels of chromatin-bound PCNA in Hmgn1−/− and Hmgn1+/+ MEFs. (E) Increased binding of PCNA to UV-damaged chromatin of Hmgn1−/− and Hmgn1+/+ MEFs. Western analyses were quantified using ImageQuant software. The graph shows the means of three biologically independent experiments, plus or minus standard deviations.

