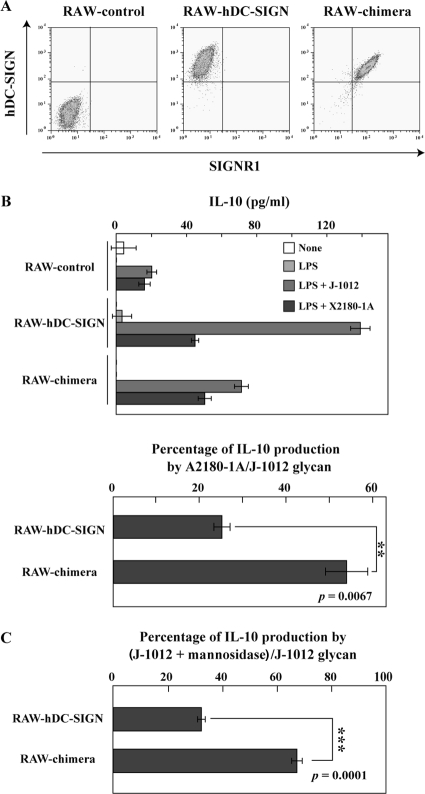
Fig 5.
IL-10 production of RAW264.7 transfectants upon stimulation with glycan on a plastic plate. (A) RAW-control, RAW–hDC-SIGN, and RAW-chimera cells were analyzed by flow cytometry using polyclonal anti-hDC-SIGN Ab and anti-SIGNR1 MAb (22D1) specific for the SIGNR1 CRD. (B) The transfectants (5 × 10⁴ cells) were cultured on plates precoated with C. albicans J-1012 and S. cerevisiae X2180-1A (WT) glycan in the presence or absence of LPS (100 ng/ml). After 24 h, IL-10 in the supernatants was analyzed (top). IL-10 production against S. cerevisiae glycan is shown as a percentage of that against C. albicans glycan (bottom). (C) IL-10 production after stimulation with native and α-mannosidase-treated C. albicans J-1012 glycan was analyzed as in panel B. IL-10 production against the treated glycan is shown as a percentage of that against the native glycan. **, P = 0.0067, and ***, P = 0.0001 by Student's t test.

