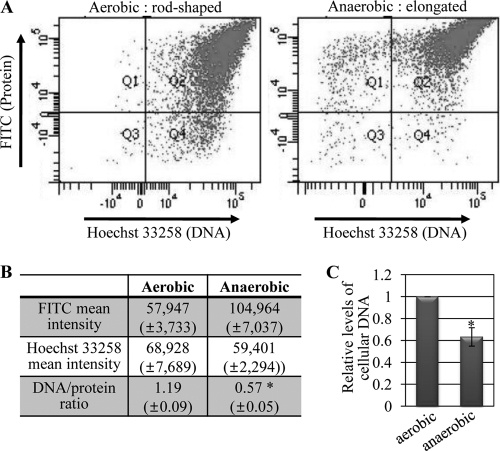
Fig 1.
Relative DNA content per cellular protein was decreased in elongated PAO1 cells. (A) Double-fluorescent dot plot analysis of PAO1. Bacterial cells (∼10,000 cells) grown aerobically or anaerobically in LBN for 16 h were stained with Hoechst 33258 and FITC for a quantitative presentation of cellular DNA and protein contents, respectively. In the dot plot, x and y axes represent the intensities derived from Hoechst 33258 (blue, for DNA) and FITC (green, for proteins), respectively. The plot is divided into four quadrants (Q1 to Q4). Quadrant Q2 contains PAO1 cells labeled with both dyes. (B) Average fluorescence intensities of PAO1 cells grown under either condition. The DNA/protein ratio was calculated by dividing the mean Hoechst 33258 intensity by the mean FITC intensity. The values shown are the means ± SDs from three independent experiments. *, P < 0.01 versus DNA/protein ratio of aerobically grown cells. (C) DPA assay of PAO1 cells grown in LBN under aerobic or anaerobic conditions. Bacterial cell extracts containing equal protein contents were used for the assay, and the DNA contents of anaerobically grown cells were normalized with those of aerobically grown PAO1 cells. Three independent experiments were performed, and values of means ± SDs are displayed in each bar. *, P < 0.01 versus DNA contents in aerobically grown PAO1 cells.

