
Fig 2.
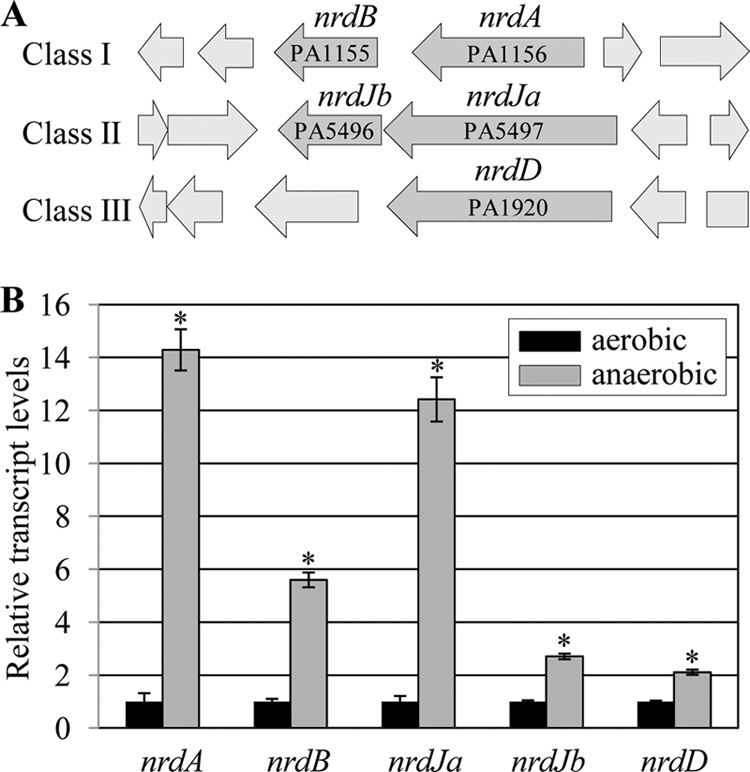
Quantitative RT-PCR analysis of genes encoding three different classes of RNR. (A) Open reading frame maps of RNR-coding regions in PAO1 genome. Three different genetic loci encoding a component(s) of each class of RNR are shown with corresponding PA numbers. (B) qRT-PCR was conducted on cDNA synthesized from 2 μg total RNA extracted from PAO1 cells grown either aerobically or anaerobically. Transcript levels of the five genes indicated at the bottom of each set of bars were normalized with levels of the rpoD transcript. Three independent experiments were performed, and values of means ± SDs are displayed in each bar. *, P < 0.05 versus transcript levels in PAO1 cells grown aerobically.