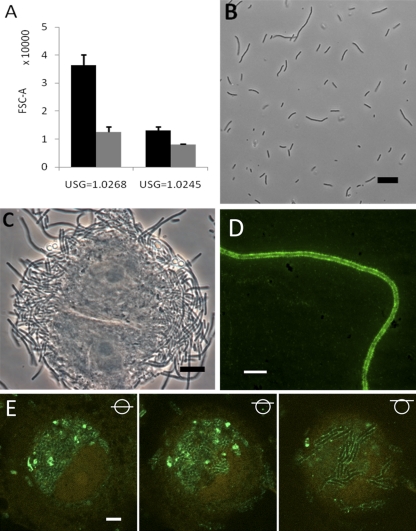
Fig 4.
Filament enrichment on FC-BEC layers correlates with observed increased filament adhesion. (A) Examples showing the difference in filamentation after 24 h of FC secondary surface colonization (black columns) compared to that seen after 24 h of UTI89 static suspension growth (gray columns) in highly and moderately concentrated urine. Mean values representing the results of two independent FC experiments and three static experiments are shown; P = 0.0023 and 0.0051, respectively (two-sample t test). (B) Microscopy of UTI89 statically grown for 24 h in the most concentrated urine tested in FCs (compare with Fig. 3H). (C) PD07i cell obtained during filament harvest, showing tight association with filaments. (D) Fluorescence micrograph showing type 1 pili on a harvested filament. (E) CLSM analysis of UPEC type 1 pilus expression in an extensively colonized, partly degraded cell in the FC-BEC layer. The left image shows type 1 pilus-expressing UTI89 in the BEC cytoplasm next to a distorted cell nucleus. The middle and right images are scans made at positions of successively increasing heights (indicated with symbols), showing type 1 pilus-expressing UTI89 in the upper part of the cell (middle image) and filamentous UTI89 bacteria at the cell membrane that express type 1 pili along their lengths (right image). Bars, 10 μm (C, D, and E) and 20 μm (B).

