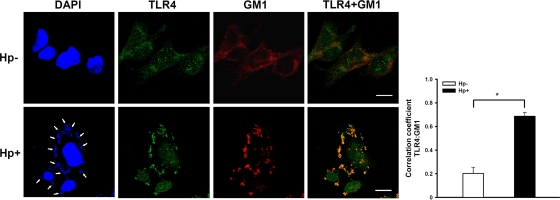
Fig 5.
Mobilization of TLR4 into cholesterol-rich microdomains at sites of H. pylori infection. AGS cells were infected with H. pylori (or not infected) at 37°C for 6 h. Cells were fixed and stained with anti-TLR4 (green), with Alexa Fluor 647-conjugated CTX-B to visualize GM1 (red), or with DAPI (blue) to visualize bacteria (arrows) and the cell nucleus. Samples were analyzed by confocal microscopy. The colocalization of TLR4 with GM1 appears yellow in the overlay. The colocalization of fluorescence for TLR4 and GM1 signals was quantified using the Pearson correlation coefficient, and the data are presented in the right panel. Statistical significance was determined for 3 independent experiments. *, P < 0.01. Bars, 10 μm. Hp−, not treated with H. pylori; Hp+, treated with H. pylori.

