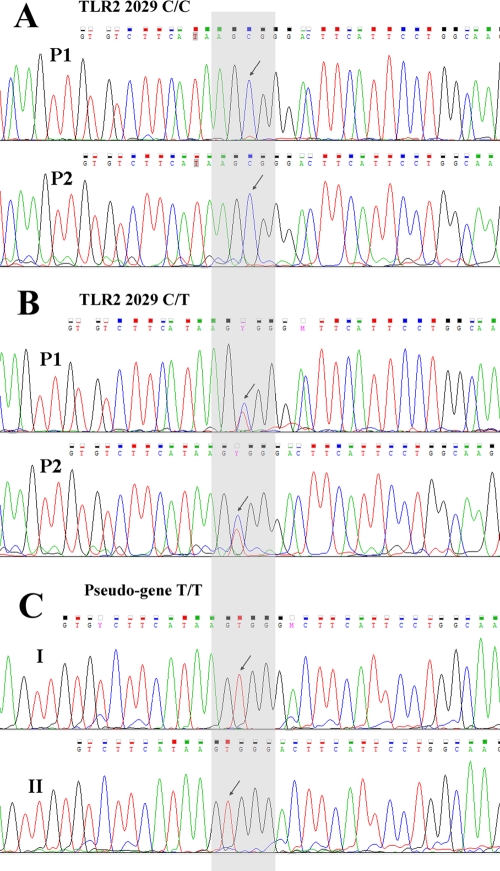
Fig 1.
(A) Electropherogram pattern for no mutation at TLR2 position 2029. The wild-type state (C allele) is indicated by the black arrows at nucleotide position 2029 when analyzed by using either the P1 or P2 gene-specific primer pair. (B) Electropherogram pattern for 2099C>T heterozygous samples (Vlax-Roma). The heterozygous state is indicated by the black arrows and the Y ambiguity code (IUPAC nucleotide ambiguity codes) when analyzed by using either the P1 or P2 gene-specific primer pair. (C) Sequence analysis of the region upstream of the TLR2 gene with 93% sequence identity to the third exon. The black arrows indicate the T/T homozygous variant present in both wild-type (2029C/C) (I) and heterozygous (2029C/T) (II) samples.

