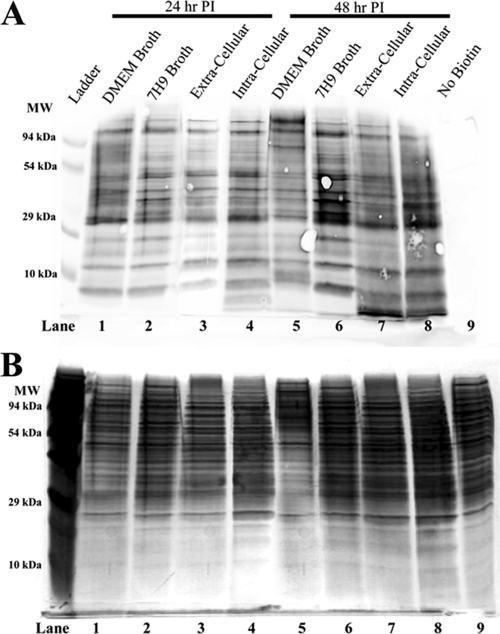
Fig 3.
Comparison of biotinylation profiles from all experimental samples. (A) Biotinylation profiles of total protein from each experimental condition. To assess changes in global biotinylation patterns between conditions, aliquots of total protein were analyzed from each sample prior to affinity purification. Samples were from both time points, 24 h (lanes 1 to 4) and 48 h (lanes 5 to 9), and all culture conditions, DMEM (lanes 1 and 5), 7H9 medium (lanes 2 and 6), ECB (lanes 3 and 8), and ICB (lanes 4 and 9). Biotinylation profiles were analyzed by anti-biotin Western blotting. (B) Silver-stained SDS-PAGE gel of the same protein samples.

