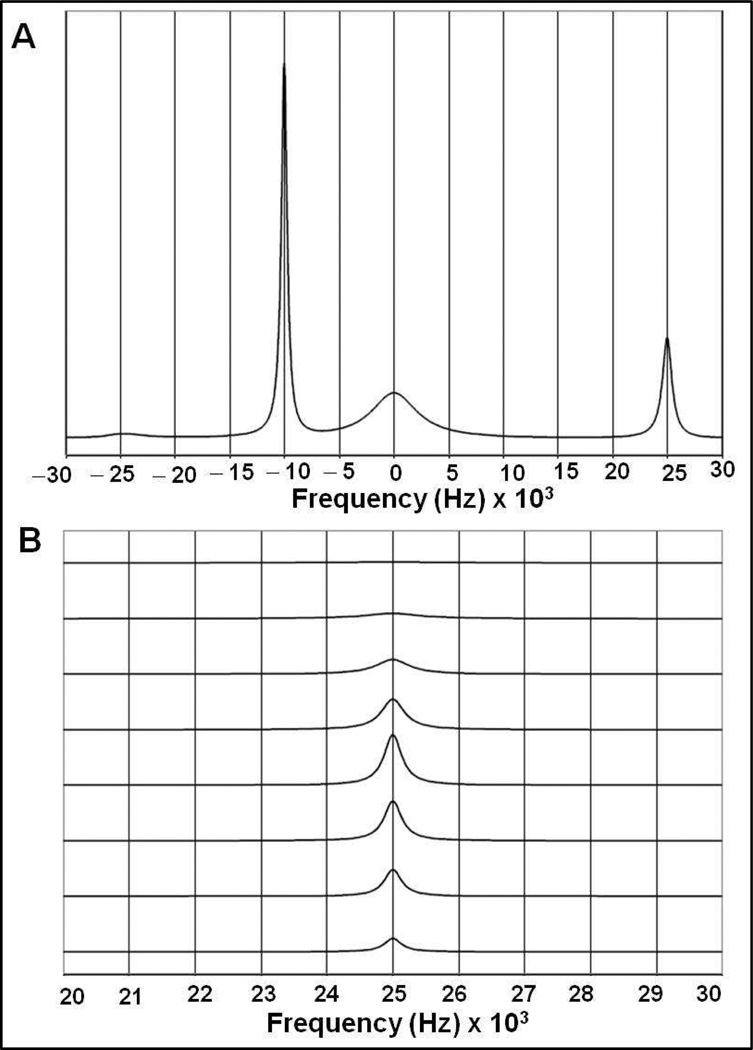
Figure 7.
Simulation results of the 5-site exchange NMR spectra according to the model represented in Figure 6 and using equations 8 and 9. Site α (free cadmium(II)) resonates at −25000 Hz; site β (the “primary” buried site in species Q) at +25000 Hz; site γ (the surface site in species R) at −15000 Hz (concentration too low to be visible); site δ (the buried site in species S) at 0 Hz; site ε (the surface site in species S) at −10000 Hz. All sites have R2 = 1000 s−1. Site-site exchange rates were derived from the rates in Figure 4, as indicated in Figure 6 with values as listed in the legend of Figure 5 and tables S1 and S2 of the SI.
A. Total protein concentration = 4 mM (trimer); total ligand concentration = 9.0 mM.
B. Simulation results obtained for different ratios of [Cd]total/[P] total. Only the signal for site β (the buried site in species Q) at +25000 Hz is shown. From bottom to top the traces are obtained using the following ratio: [Cd]total/[P] total = 0.25, 0.50, 0.75, 1.00, 1.25, 1.50, 1.75 and 2.00 with [P] total = 4 mM (trimer).

